|
Figure 1
:
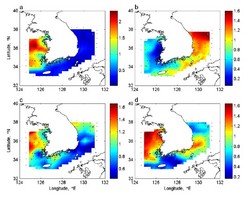
The Korean peninsula is surrounded by three marine ecosystems. The East/Japan Sea, to the east of Korea is a large, deep (>1000 m) basin. The East China Sea, to the south of Korea is larger in surface area, but shallower than the East/Japan Sea. The Yellow Sea to the west is a shallow, semi-enclosed shelf sea. The mean depth is ca. 44m, with a central trough reaching only about 90m.
|

|
|
Figure 2
:
Dominate large-scale EOF spatial patterns for zooplankton with using data from 1965 through 2000. a) chaetognaths concentrations, mode 1(23.3%), showing strong gradient between Yellow Sea and East China Sea; b) Zooplankton biomass, mode 1 (20.2%), showing an east-west gradient, with highest values in the East/Japan Sea and lowest values in the Yellow Sea; c) Amphipod concentrations, mode 1 (25.8%), showing a north-south gradient in all three seas; d) Copepod concentrations, mode 1 (20
|
|
|
Figure 3
:
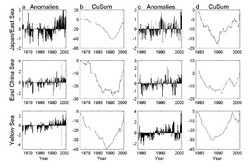
Amplitude time series and cumulative sums plots for EOF 1st modes for zooplankton biomass (ln(mg m-3)) and copepod concentrations (ln(individuals/m3)) with using data from 1965 through 2000. a) Amplitude time series, zooplankton biomass; b) Cumulative sums plots, zooplankton biomass; c) amplitude time series, copepod concentrations; d) Cumulative sums plots, copepod concentrations.
|
|
|
Figure 4
:
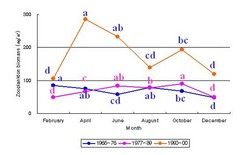
Seasonal cycles in zooplankton biomass in Korean waters in response to regime shifts: 1965~76, 1977~89 and 1990~2000. Different letter indicates significantly different mean (Duncan's multiple comparison test; p<0.05).
|
|