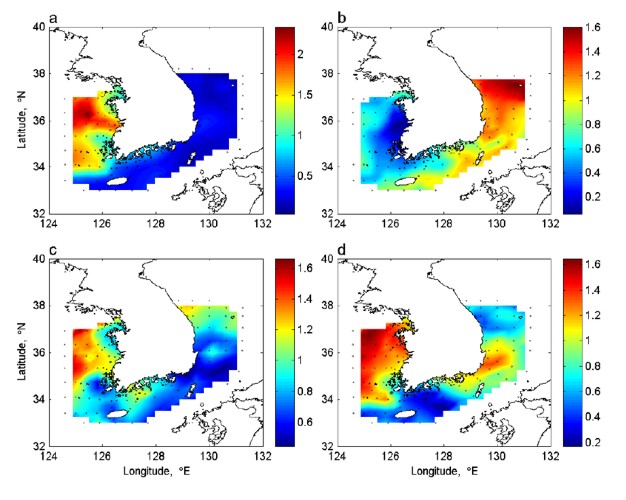
| Figure 2: Dominate large-scale EOF spatial patterns for zooplankton with using data from 1965 through 2000. a) chaetognaths concentrations, mode 1(23.3%), showing strong gradient between Yellow Sea and East China Sea; b) Zooplankton biomass, mode 1 (20.2%), showing an east-west gradient, with highest values in the East/Japan Sea and lowest values in the Yellow Sea; c) Amphipod concentrations, mode 1 (25.8%), showing a north-south gradient in all three seas; d) Copepod concentrations, mode 1 (20 |