


Why is MRIP making changes to the effort survey?
On the Atlantic and Gulf coasts, NOAA has traditionally estimated effort through the Coastal Household Telephone Survey (CHTS). The CHTS uses a method called random-digit dialing (RDD) targeting households in coastal counties. RDD has for years been widely accepted as an effective survey method, and focusing on the coastline has been the best way to find saltwater anglers. However, there are also several well-known shortcomings with this approach:
RDD is inefficient at identifying anglers. Many calls go to households where no anglers live, and we do not contact anglers who live inland.
With more people abandoning landlines for cell phones, which are not included in our telephone survey, a growing number of potential anglers has become unreachable. Currently, only 6 in 10 U.S. households have a landline phone, down from nearly 100 percent as recently as 1998*.
Response rates, or the number of people who actually pick up the phone and answer the questions, are declining for all telephone surveys. This is true whether for fishing effort, public opinion polls, or attitudes about a commercial product or service.
In addition, our research suggests that people may not do as well remembering all their fishing activity when asked over the phone.
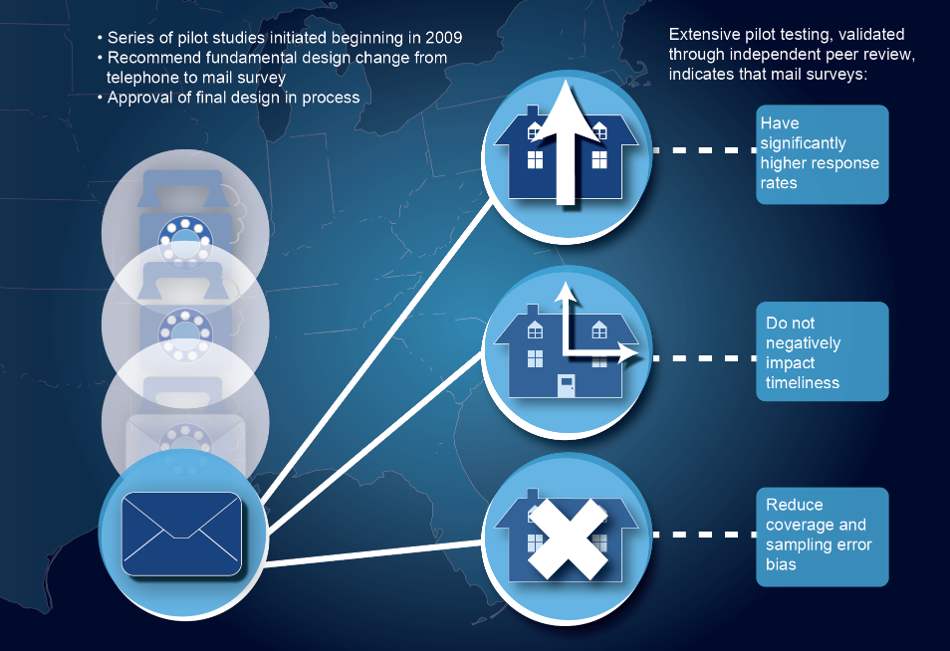
All of these issues can result in bias, or factors that can skew our survey results. These include undercoverage (not reaching all anglers); nonresponse (people not answering the survey); and measurement error (inaccurate answers by respondents). Over the past several years MRIP has conducted a series of pilot studies to determine the best way to redesign our effort survey to reduce these potential biases.
*Blumberg, SJ and Luke, JV. Wireless substitution: Early release of estimates from the National Health Interview Survey, July-December 2012. National Center for Health Statistics. June 2013. www.cdc.gov/nchs/nhis.htm
The Transition Process
As with any changes to angler surveys, we are unable to accurately predict what differences we will see in effort estimates based on our improved methodology. However, we know that we’ll be doing a better job of contacting more anglers. This will include anglers who are not covered in the existing survey, which we expect will have an impact on the numbers.
From the results of our extensive series of pilot studies, we also know that our new survey will likely show increases – and in some cases potentially significant increases – in overall fishing effort. Because of the complex relationship between effort estimates and other data that go into determining fishery health, higher effort estimates alone do not necessarily mean that overfishing has or is occurring. In addition, we can’t know how the results we’ve seen from our pilot study conducted over a limited amount of time and geography will play out on a larger scale. It will take further work before we can determine exactly how the new numbers compare with those from our current survey, and how they fit into the stock assessment – and ultimately management – processes.
To develop a transparent, inclusive means of converting to the new methods, MRIP created a cross-disciplinary Transition Team consisting of managers, stock assessors, scientists and state partners. The charge of the team was to produce a comprehensive strategy to transition from the current Coastal Household Telephone Survey (CHTS) to the new mail-based Fishing Effort Survey (FES). After in-depth discussions, the team developed a three-year plan to ensure that potentially significant impacts to the science and management processes are well thought out and accounted for, to the best of our ability, before transitioning to this new methodology for estimating effort.

- Benchmarking (2015-2017): The new survey design will be conducted side-by-side with the current design for three years to allow measurement and evaluation of consistent differences in the statistical estimates produced.
- Development of a calibration model (2016-2017): Consistent differences between new design and legacy design estimates will be evaluated to determine possible sources of bias in the legacy design that can explain those differences.
- Re-estimation of historical catches (2017): Once a calibration model has been approved, the model will be used to generate a corrected time series of recreational catch statistics.
- Incorporation of revised statistics into stock assessments (2018): The revised catch statistics will be incorporated into stock assessments as soon as possible to provide the most accurate assessments of stock status and provide new ACLs for use in fisheries management.
- Incorporation of revised statistics and new ACLs into management actions (2018): Once both revised catch statistics and new assessment results become available, management actions should begin to use both for decision making as soon as possible.
- Discontinuation of the CHTS and full implementation of the FES (2018): After the three year benchmarking period, NOAA Fisheries will discontinue the use of the CHTS and all future estimates will be based on the new mail-based FES.
Implications
Stock Assessments and Recreational Effort
One might assume that higher effort numbers would automatically mean that there are fewer fish out there to catch. However, this is not necessarily the case. Here’s why:
Our studies indicate that the increase in effort estimates is due to the fact that we are doing a better job of capturing fishing activity, not a sudden rise in fishing. However, it will take multiple years of side-by-side comparison to fully understand the differences.
Once we identify the factors that are making the numbers different, we can look back at historical estimates, calibrate the variance, and determine to the extent possible whether past fishing activity was higher than estimated.
Because the number of fish being caught is an indicator of fishery health, if effort rates were actually higher in the past than we estimated, then it is possible we were underestimating the number of fish in the population to begin with.
Survey Details
Using license and registration information to survey fishermen
In the CHTS, we survey anglers by randomly dialing phone numbers of people who live in coastal counties in the states where we conduct the survey. We make a lot of phone calls to homes where there are no fishermen, and we do not call people who fish but don’t live on the coast. The FES is much more efficient because we use address information from state recreational saltwater fishing license and registration databases, via the National Saltwater Angler Registry, to target known anglers. So if you’re someone who lives in Montana but spends the summer fishing in North Carolina, there’s a chance that your name could be selected from the license database to receive a mail survey.
Look and feel
The new FES isn’t just a fishing survey. It’s been designed as a “Weather and Outdoor Activity Survey” because it’s important to get information from fisherman and non- fishermen alike; and we found that both groups were more likely to answer and return a more general survey. This is important because maximizing the number of responses we get will minimize the risk of nonresponse bias. Nonresponse bias in the CHTS is one of the major concerns driving the shift to the FES.
Incentive
To further help reduce the risk of nonresponse bias, the mail survey includes a $2 prepaid incentive. Why $2? We tested $1, $2, $5, and a control group receiving no incentive. As you might expect, the greater the incentive, the greater the response rate. So, in reality, the incentive is not just a cost, it’s also an investment in getting better data. That’s because every time someone responds to the survey right away, it saves us the later cost of following up by mail or phone. Based on the results of our study, $2 was the most cost-effective amount for an incentive, which we weighed against the costs of following up (including staff time, paper, postage, etc.) and the number of returned surveys. Factoring all costs of getting a returned survey, including the $2 incentive actually decreases the overall cost.
Making it easier for individuals to respond
Learn more
To learn more, check out the peer-reviewed report of the last phase of the effort study.
Fishing Effort Survey
The following FAQs address questions that have been asked about the specifics of the mail survey.
Why is MRIP making changes to the way fishing effort is estimated?
On the Atlantic and Gulf coasts, NOAA has traditionally estimated shore and private boat fishing effort through the Coastal Household Telephone Survey (CHTS). The CHTS uses a method called random digit dialing (RDD) to target households in coastal counties with landline telephones. RDD has been widely accepted as an effective survey method for many years, and focusing on the coastline has been a good way to find saltwater anglers. However, there are several well-known potential problems with this approach that could result in biased or skewed estimates.
- Non-coverage: With more people abandoning landlines for cell phones, which are not included in landline RDD telephone surveys, a growing number of potential anglers are now unreachable. Currently, only 60 percent of U.S. households have a landline phone, down from nearly 100 percent as recently as 1998.
- Nonresponse: Response rates, or the percentage of households who pick up the phone and answer survey questions, are declining for many U.S. telephone surveys. This is true whether surveying fishing effort, public opinion, or attitudes about a commercial product or service.
- Measurement: Our research indicates that many telephone survey respondents cannot accurately recall past fishing trips.
- In addition, the CHTS is inefficient for collecting fishing information as many calls go to households with no anglers.
Testing of the mail-based Fishing Effort Survey (FES) suggests that the mail survey design produces more accurate estimates than the CHTS. The new method achieves much higher response rates than the CHTS, minimizing the risk of nonresponse bias, and the FES sample comes from all valid postal addresses within coastal states, essentially eliminating the risk for non-coverage bias. In addition, the mail survey provides respondents with more time than the CHTS to think about survey questions and provide an accurate response.
Effort estimates from the new FES pilot study were reported to be 2-6 times higher than from the CHTS. Were the changes mostly related to mode, state, or wave?
The FES pilot study was conducted over a 16 month period in Massachusetts, New York, North Carolina, and Florida. Differences between FES and CHTS effort estimates were variable among states and waves. However, FES estimates were consistently greater than CHTS estimates; differences ranged from a factor of 2.1 for boat fishing in North Carolina to 6.4 for shore fishing in Florida.
Do these higher numbers mean that overfishing is or has been occurring?
No. The higher effort numbers will result in a proportionately higher estimate of total catch. However, this catch increase is a result of the change in survey methodology, and not in an actual increase in the number of fish harvested.
There is a complex relationship between estimates of fishing catch and the way scientists determine the abundance and health of fish stocks. Individual fishery stock assessments must be updated with the revised catch estimates before we can state with certainty how the new estimates will affect stock status. The FES Transition Plan calls for conducting the FES and CHTS side by side for three years, in order to develop a quantitative comparison of the effort estimates derived from the two survey methods, and to develop a calibration model that will enable scientists to estimate what the past estimates of catch would have been had the FES been implemented in prior years. Once that calibration is complete, NOAA Fisheries will begin to update fishery stock assessments for key Atlantic and Gulf coast stocks beginning in 2017.
When will the Fishing Effort Survey be considered "best scientific information available?"
Catch estimates based on the Fishing Effort Survey will not be considered best available science until historical catch estimates have been adjusted to account for the fishing effort estimates that would have been obtained if the FES had been used in place of the CHTS in prior years and these adjusted effort and catch statistics have been incorporated into stock assessments and the setting of new Annual Catch Limits (ACLs).
It is very important that we measure, understand, and explain differences between the CHTS and FES and how those differences may have changed over time, so that we can develop appropriate models to appropriately correct historical catch statistics. CHTS estimates do not reflect the actual amount of fishing effort that has occurred in the past due to sources of survey error that have been addressed in the FES design, such as degradation of random digit dialing (RDD) telephone survey effectiveness over the years. Once historical estimates have been corrected, they can be incorporated into stock assessments and new ACLs can be established. At that point, estimates based on the new survey design will become the “best available” for monitoring catch relative to an ACL, and the CHTS will no longer need to be continued. While we understand that the CHTS design has its limitations, its continued use for management purposes during the transition is necessary for maintaining a consistent time series. This does not affect the sustainability of our stocks as effort data are only one piece of information used to determine how well a stock is doing. Once we can compare the CHTS and FES estimates in the same ‘currency,’ we will better be able to manage all of our fisheries.
Research studies will continue in parallel with this transition process to better understand and explain differences between the current estimates produced by the new FES and the CHTS.
How soon will FES estimates be available for management use?
We will not use estimates from the mail survey until we can make accurate comparisons to past estimates and determine how to apply them to stock assessments and annual catch limits. A Transition Team of federal/state/council/commission staff has completed a transition plan to switch from the CHTS to the FES in the most efficient manner to minimize impacts to the stock assessment and management processes. The process is as follows:
- Benchmarking (2015-2017): The new survey design will be conducted side-by-side with the current design for three years to allow measurement and evaluation of consistent differences in the statistical estimates produced.
- Development of a calibration model (2016-2017): Consistent differences between new design and legacy design estimates will be evaluated to determine possible sources of bias in the legacy design that can explain those differences.
- Re-estimation of historical catches (2017): Once a calibration model has been approved, the model will be used to generate a corrected time series of recreational catch statistics.
- Incorporation of revised statistics into stock assessments (2018): The revised catch statistics will be incorporated into stock assessments as soon as possible to provide the most accurate assessments of stock status and provide new ACLs for use in fisheries management.
- Incorporation of revised statistics and new ACLs into management actions (2018): Once both revised catch statistics and new assessment results become available, management actions should begin to use both for decision making as soon as possible.
- Discontinuation of the CHTS and full implementation of the FES (2018): After the three year benchmarking period, NOAA Fisheries will discontinue the use of the CHTS and all future estimates will be based on the new mail-based FES.
Does the mail survey account for unlicensed anglers - those that are required to be licensed or registered but are not and those that fish legally because they don't need a license (e.g., under age 16, etc.)? Did all states participating in the pilot study require fishing licenses?
Yes. Even though some anglers may not require a license, all potential anglers can be sampled from the lists of residential addresses that are used as a sample frames for the mail survey. All states that participated in the pilot study do require licenses or registrations.
How will the National Saltwater Angler Registry (NSAR) be used in the new survey?
All Atlantic and Gulf coast states are providing data from their recreational saltwater licenses and registrations to the NSAR database. The NSAR database is matched to samples of residential addresses that are selected from a comprehensive list of all addresses maintained by the U.S. Postal Service. This matching divides the samples into two sampling groups – addresses with licensed anglers and addresses without licensed anglers. Being able to identify these groups allows us to target sampling towards households with licensed anglers. In other words, it allows us to sample households with licensed anglers, which are more likely to report fishing, at a higher rate than households without licensed anglers. This is effectively the same as sampling directly from the NSAR database, but also provides coverage of anglers who fish without a license and are not included on NSAR.
Are FES respondents who fished more likely to respond to the mail survey than those who did not fish, and how is that potential bias treated?
FES pilot study results clearly demonstrate that households with licensed anglers are much more likely to respond to the survey and report fishing activity than households without licensed anglers. Consequently, fishing households are over-represented in FES samples - there is a higher percentage of fishing households in the sample than in the population as a whole. This would result in biased estimates if not accounted for, but we account for the disparity during our weighting and estimation process.
How did you arrive at using a cash incentive? Isn’t including an incentive cost-prohibitive?
In the FES testing we experimented with cash incentives of $1, $2, and $5, as well as a non-incentive control group. The goal of the incentive testing was to identify an optimum level of incentive that maximizes overall response while controlling costs and minimizing the potential for nonresponse bias. All three incentive amounts significantly increased the number of completed surveys, and the additional costs of the $1 and $2 incentives were more than offset by the gains in the number of completed surveys. In other words, including a $1 or $2 incentive actually decreased overall data collection costs.
Could the estimated increase in fishing effort among shore anglers in the FES over the telephone survey be due to socio-economic differences in response rates, due to the monetary incentive in the mail survey?
We examined the impacts of incentives on both response rates and reported fishing activity, overall and by fishing mode. While incentives had a significant impact on response rates, we did not observe any differences in reported fishing activity among incentive treatments. This suggests that the additional respondents were no more or less likely to fish, overall or in a particular fishing mode, than those who would have responded without an incentive. Consequently, we do not believe that incentives contribute to the observed differences between CHTS and FES estimates for either shore or private boat fishing.
As discussed in detail in the pilot study report, our working hypothesis is that a greater contributor to the difference between private boat fishing and shore fishing is recall error – or the ability to accurate recall all fishing trips. Simply put, we believe that the extra costs and logistics involved in a private boat trip make it more memorable than a day of fishing on the beach or at the pier. With the phone survey, people are asked to drop whatever they’re doing and think back over their fishing activities from the past two months. The mail survey enables people to take more time to think about their activity, or possibly even consult their calendar - potentially increasing recall of fishing activities.
When conducting the mailing survey, what percentage of mailings goes to the random USPS database addresses vs. the angler registry database addresses?
The distribution of mailings between licensed and unlicensed households varies by state and sampling period (two-month “wave”). Overall, we use a sample from a comprehensive USPS database of addresses and compare that to the list of addresses from the license and registry database, and match the addresses found. This matching divides the samples into two sampling groups – addresses with licensed anglers and addresses without licensed anglers. Being able to identify these groups allows us to target sampling towards households with licensed anglers. Therefore, we sample the licensed anglers at a higher rate, in all states and two-month waves. We do this because we know those people are more likely to fish which ensures that estimates are based upon data provided by a large, representative sample of anglers. The goal of the sampling design and sample distribution is to maximize the precision of effort estimates for each state and wave.
Does the survey account for anglers in for-hire vessels?
No. The new mail survey only asks about fishing trips made from shore and or on a private or rental boat.
Effort data for charter boats in the Atlantic and Gulf fisheries, and for head boats in the Greater Atlantic Region, are derived from a separate weekly telephone survey of for-hire vessel operators, the For-Hire Survey. Both catch and effort data for head boats in the Southeast Region are derived from the Southeast Head Boat Survey, a trip-reporting program operated by NOAA’s Southeast Fisheries Science Center.
Will the mail survey allow for going to a monthly data reporting system versus the current 2-month waves?
Yes, the FES design can collect data and produce estimates for 1-month reference waves. We will begin testing the impacts of 1-month reference periods on data quality beginning in July, 2015.
Will the mail survey differentiate effort between state and federally managed species that could potentially be used to develop a database of "offshore" anglers?
No, the current mail survey questionnaire does not differentiate between fishing locations (state vs. federal waters) or targeted species. The mail survey questionnaire was designed to collect the minimum amount of information needed to estimate total shore and private boat fishing effort within a state during a two-month reference period. However, mail survey estimates can be combined with estimates from the Access-Point Angler Intercept Survey to estimate effort at finer levels of resolution, including effort by area fished and effort targeting a particular species or species group. Utilizing FES samples would not be a recommended approach to develop a comprehensive database of offshore anglers, regardless of the nature of information collected in the survey.
Does MRIP account for potential changes that may occur within the U.S. Postal Service?
The MRIP process is a continuous cycle of assessment, evaluation, and improvement. We will continue to monitor the effectiveness of mail surveys, as well as be responsive to changing technologies and the opportunities they present, to ensure the methods we use are providing optimal results.
Is a mail survey really the best way to survey anglers today?
We are extremely confident that the FES design is a superior alternative to the CHTS, as well as other designs that have been considered and evaluated. The FES sample frame, which is maintained by the U.S. Postal Service, provides nearly complete coverage of the entire U.S. population, nearly eliminating the risk of non-coverage error, and when combined with the National Saltwater Angler Registry, provides an efficient mechanism for sampling saltwater anglers. In addition, testing of the FES design resulted in response rates that were 3 times higher than the current telephone survey, minimizing potential errors associated with low response rates. Finally, we believe that the nature of mail surveys, which gives respondents more time than telephone surveys to consider their responses, results in more accurate responses to survey questions.
How can NOAA be confident the results from new mail survey are more accurate?
Sound, scientific methods deliver sound, reliable results. As with all MRIP improvements, the new mail survey is the result of extensive testing. NOAA’s own statisticians worked with some of the nation’s leading survey design experts to develop and test these methods in the field. Those results were peer-reviewed by independent experts who endorsed the mail survey as a much better approach than the current telephone survey design.
Has MRIP explored using internet surveys?
Yes. MRIP has and will consider additional response options, including Internet surveys. Approximately 25 percent of U.S. households do not have Internet access, and research suggests that providing an Internet response option may actually decrease response rates. It’s possible that in the future internet surveys may become more efficient and provide additional options for surveying anglers.
Transition Plan
The following FAQs address questions that have been asked about the transition from the Coastal Household Telephone Survey to the mail-based Fishing Effort Survey.
How many members serve on the Transition Team, and how long will the Team be in place?
The Transition Team was formed to develop and recommend a standardized process for transitioning from historical estimates to estimates derived from improved sampling and estimation designs, and to develop Transition Plans for the implementation of new methods as required per the process. The cross-disciplinary Team currently includes 34 members and participants representing a range of state and federal agencies, including staff from regional fishery management councils and commissions. The Team is a permanent group within MRIP as the need for efficient and timely planning of implementing new survey designs will be ongoing. Visit the MRIP website to learn more about the Transition Team and all MRIP Teams. The site will also be updated with details of Team meetings, as well as a library of pertinent documents.
Who developed the Transition Plan?
An Atlantic and Gulf coast subgroup of the full Transition Team met weekly from December 2014 to April 2015 to develop the most appropriate way to shift to the new mail survey while minimizing impacts on management and assessment activities. The Transition Team is comprised of experts from NOAA Fisheries, Regional Fishery Management Councils, Interstate Marine Fisheries Commissions, and state agencies.
What are the advantages of a 3 year approach versus trying to start the Fishing Effort Survey sooner?
The 3 year approach developed by the Transition Team was determined based on in-depth discussion about how to effectively manage the task of incorporating new estimates that are expected to be significantly different from the current estimates. Overall, the Team determined it was more important to ‘get it right the first time,’ rather than trying to move faster without fully understanding the full impact of the new effort estimates. By doing this, the best available scientific information will be used for better management of fisheries to ensure sustainable, healthy stocks.
Additionally, taking our time to make sure that we get it right will allow for:
- A more stable calibration as there could be interannual variability;
- More time to prepare for stock assessment and management processes that will need to be accelerated to complete the incorporation of revised historical catch statistics within the desired time frame, potentially allowing for more updates to occur in 2017;
- A longer time to prepare for the potential ramifications due to the higher estimates produced from the Fishing Effort Survey; and
- More information to be determined through research studies to help explain the differences in effort estimates produced by the two surveys.
What steps need to take place to incorporate the new survey into the management process?
There are several steps that must be taken before estimates based on any new design can be used effectively in the management process.
1) Benchmarking (2015-2017): The new survey design will be conducted side-by-side with the current design for three years to allow measurement and evaluation of consistent differences in the statistical estimates produced.
2) Development of a calibration model (2016-2017): Consistent differences between new design and legacy design estimates will be evaluated to determine possible sources of bias in the legacy design that can explain those differences.
3) Re-estimation of historical catches (2017): Once a calibration model has been approved, the model will be used to generate a corrected time series of recreational catch statistics.
4) Incorporation of revised statistics into stock assessments (2017-2018): The revised catch statistics will be incorporated into stock assessments as soon as possible to provide the most accurate assessments of stock status and provide new annual catch limits (ACLs) for use in fisheries management.
5) Incorporation of revised statistics and new ACLs into management actions (2018): Once both revised catch statistics and new assessment results become available, management actions should begin to use both for decision making as soon as possible.
Effects and Implications
The following FAQs address questions that have been asked about potential implications of both the pilot study results and the transition to the new survey method.
How might the new effort estimates from the mail survey affect stock assessments, catch limits, or regulations like quota allocations based on historical effort?
There will be no immediate impacts. We will not know the specific effects of data collected by mail survey for several years, and affects will vary depending on factors such the magnitude of change and how large the recreational fishery is for a particular stock. We would not use estimates from the mail survey until we can make accurate comparisons to past estimates and determine how to apply them to stock assessments and use in management decisions.
Do the higher estimates mean anglers were overfishing their quotas?
Higher rates of fishing activity do not necessarily equate to overfishing nor does it mean we have under-estimated fishery abundance. Recreational fishing data is often just one input into a stock assessment. The relationship between recreational effort estimates and stock assessments is complex and varies by fishery. We will continue to use multiple sources of data to monitor fish stocks for signs of overfishing. Maintaining the collective gains we’ve made in ending overfishing and supporting long-term sustainability remain foremost in our minds.
Why will you continue to use the phone survey if the results are so different? Is it still the best available source of data?
We will continue using the long-term, consistently derived estimates of fishing effort generated from the existing phone survey until it is replaced by another source of information that can be integrated into our science and management activities. Only when the calibration of the two methods is fully completed and stocks have been re-assessed using the calibrated FES effort estimates will these estimates from the mail survey be considered best scientific information available.
Effects and Implications - Regional
The following FAQs address questions that have been asked about potential implications of both the pilot study results and the transition to the new survey method at a regional level.
Why are some MRIP estimates so much higher than some state estimates of the same fisheries? For example, the MRIP effort estimates are four times higher than the Alabama state estimates in 2014.
Surveys currently being tested in the Gulf States are not measuring the same things as the coast-wide MRIP survey. Alabama, Mississippi, Florida, and Texas are testing survey methods that focus on accurately measuring the catch for a smaller number of specific species (e.g. red snapper), while the MRIP methods focus on measuring the catch of all species coast-wide.
Additionally, the 2014 Alabama and Mississippi estimates are the preliminary results of pilot projects and may not be consistent with either MRIP results or with each other. Both states have refined their red snapper survey designs in response to recommendations from MRIP’s expert consultant team and are implementing a second year of pilot testing in 2015. Before such results are available for use by NOAA Fisheries, they will need to be fully documented and evaluated, including by an independent peer review. Once the project results have been fully compiled and evaluated, NOAA Fisheries and the states will be able to determine which designs should be accepted and made available for future use in management and stock assessment. If one of these designs is accepted, it would then need to undergo a benchmarking and calibration effort similar to what is being done for the mail survey design. Any new designs must be calibrated with the historical time series before it can be considered best scientific information available and used in management decisions.
Why can't the agency just use data collected by the state? For example, why doesn't NOAA use Louisiana's new data collection program (LA creel).
Some states have implemented alternative survey designs tailored to better meet a specific need. NOAA will only accept that data if two basic requirements are met: 1) the survey design must be fully-tested, documented, peer-reviewed, and approved through the MRIP certification process and 2) the new survey must undergo a benchmarking and calibration effort similar to what is being done for the effort survey so that a consistent long-term series of data are available for stock assessments. These requirements help ensure we have a consistent, comparable set of national level information on recreational fishing that meets the requirements for best scientific information available. NOAA Fisheries is actively communicating with the Gulf States about the requirements and process for approving or "certifying" new survey designs. In 2015, the LA Creel survey and the MRIP surveys are being conducted side-by-side in a benchmarking effort, and an independent review of the LA Creel design is being conducted with MRIP support.
If you can't use the data collected by Louisiana, why can you use the data collected by Texas?
Texas' survey has been consistently implemented for over 35 years. In the early 1980's, NOAA Fisheries and Texas entered into an agreement whereby Texas agreed to provide catch data produced via the data collection program for which they provided full documentation. Because Texas has provided a consistent time series of catch data, that data can continue to be used in stock assessments.
Data produced using newly-implemented alternative survey designs (such as the Louisiana data), to replace legacy MRIP data, would require benchmarking to document differences in results so that a consistent time series of estimates is available for assessment. Nonetheless, it is difficult to relate the estimates for Texas to the numbers generated for other Gulf States. Some sort of benchmarking of Texas’ estimates against MRIP would be desirable to provide a calibration that could be used to provide comparability.
How are effort data collected in the West Coast, Puerto Rico, and Pacific Islands? Will the new survey be used beyond the Atlantic and Gulf Coasts?
The Atlantic and Gulf of Mexico coasts, Hawaii and Puerto Rico all use a similar phone survey design for estimating fishing effort. The new mail survey methodology was designed as an alternative to the current phone survey used along the Atlantic and Gulf of Mexico coasts. The mail survey could, with modifications, be adapted to the unique data collection challenges in Hawaii and Puerto Rico. Hawaii is testing site-based methods (e.g. creel surveys) similar to those being used currently along the Pacific Coast.
California, Oregon, and Washington each administer their own catch and effort surveys. They primarily use site-based methods to estimate fishing effort, although California and Washington also use license-frame telephone surveys. All three states are in the process of improving their current designs and pilot testing new designs based on feedback received from the National Research Council and reviews by MRIP consultants. Consideration could be given toward moving from telephone to a mail survey approach in those states in the future.
MRIP General
The following FAQs address questions that have been asked about MRIP and progress made throughout the years.
Has MRIP really made progress?
We’ve addressed many of the concerns identified in the 2006 National Research Council‘s (NRC) independent review of NOAA’s recreational fisheries surveys. We’ve collaborated with state partners to create a National Saltwater Angler Registry, which is an integral component of an improved recreational fishing effort survey, developed a more accurate method for estimating catch rate from historical onsite survey data, and implemented a more accurate catch survey design. We will continue to make improvements to our catch and effort surveys to ensure we’re meeting the needs of our stakeholders and managing the Nation’s fishery resources sustainably.
MRIP has also requested a new NRC review of the program and its progress. We anticipate that the review will start in 2016.
When will all of the MRIP changes stop?
We are constantly evaluating the methods NOAA Fisheries uses to ensure they are providing the most accurate estimates of recreational catch and effort. MRIP will include an ongoing research program to ensure that data collection designs remain consistent with best practices and advancements in survey science and technology. We are sensitive to the disruption that new methods create, and we are working to carefully transition from historical to improved, more accurate methods.
Why have I never been surveyed under MRIP? I have been recreational fishing and never asked how many fish I caught.
Although we interview tens of thousands of fishermen each year, there are many more people fishing than we can possibly talk to. By its very nature, random sampling means that some people get interviewed, and some people don’t.
By our estimation there were about 9 million people participating in saltwater recreational fishing along the Atlantic and Gulf of Mexico coasts in 2013. In these regions, we contacted more than 200,000 households with our phone surveys and conducted 86,000 dockside/shoreside interviews.
How do you use data submitted by constituents in your MRIP estimates? Are you using iSnapper data in MRIP estimates? Why or why not?
All MRIP surveys rely on information provided by anglers. Catch and effort data are collected from samples of anglers who are selected from survey sampling designs that ensure representative, unbiased samples.
With the increased availability of tablets and smartphones, many private and public organizations are developing applications (apps) that provide opportunities for individual angler diaries or trip reporting. NOAA grant funds have supported the development of these types of tools, including iSnapper.
These types of tools potentially provide new opportunities for recreational fisheries data collection and analysis. However, the information is not collected through a survey design that ensures the data collected is representative of all fishing activity. For example, an angler may choose to volunteer information only after particularly successful trips, but not when zero fish were caught. Consequently, the data cannot be used to estimate population totals, such as total fishing effort or catch.
MRIP is evaluating how best to utilize the data collected with these tools. For more information on the utility of social media, mobile technologies, and non-probability sampling, please visit the website for the American Association for Public Opinion Research.

