

Catch Methods
Estimates of recreational catch rates and species composition are produced using information gathered from dockside interviews of anglers who have completed their fishing trips. However, in certain for-hire fisheries, catch is determined by trip reports filed by captains (Southeast Region Headboat Survey). We have made significant improvements to the way these surveys are conducted. Specific changes in our new method include:
- We are now sampling during all parts of the day. In our previous methods, we only sampled trips that ended during the day, and did not sample trips that ended at night. This introduced the potential for bias because we assumed that fishing activity was the same during night trips and daytime trips.
- We have made sampling assignments more stringent. In previous methods, samplers – the people who conduct the survey – were able to change fishing sites if the assigned site was not busy. This introduced the potential for bias because we were not able to properly account for the probability that any given site would be sampled.
Now, samplers have a set assignment that tells them what sites to visit, in what order, for how long, and what types of fishing activity (like shore or private boat) they should be surveying. Samplers are also supposed to interview all anglers, regardless of whether they caught a lot of fish or none at all. It’s important for us to know about zero catch trips, just as much as for trips catching large numbers of fish. If it gets too busy, they sample everyone they can, and count the trips that they can’t sample.
- We have created an online Site Register of public-access fishing sites from Maine to Louisiana. This online database includes everything our samplers and scientists need to know about a fishing site to ensure that the sampling assignments are representative of overall fishing activity. Information includes the location, types of fishing, site amenities, and expected fishing activity during different parts of the year, week and day.
The Site Register can also be accessed by the public to search or download. Fishermen can find sites that they might like to try, and we can “crowdsource” updates to the information, such as if major upgrades have been made or a site has become temporarily unavailable due to a storm.
Effort Methods
NOAA Fisheries has traditionally gathered information about recreational fishing effort – the number of fishing trips anglers take – through the Coastal Household Telephone Survey (CHTS), which uses a landline random-digit-dialing (RDD) design. RDD is a well-established survey protocol – whether for monitoring fishing activity, opinion polling, or measuring any number of other activities.
However, there are also known limitations with this method.
Across the survey industry, response rates to household telephone surveys have dropped significantly over the years. However, some phone surveys, like the For-Hire Survey do not have this same issue.
There is also a shrinking number of households who have a landline phone. Many people are switching to cell phones, which cannot be included in landline RDD telephone surveys.
Finally, research suggests that people don’t necessarily do a great job reporting several weeks’ worth of fishing activity in an unexpected telephone interview.
To address these concerns, MRIP conducted a series of studies to figure out the best way to reach as many anglers as possible, ensure high response rates, and improve the quality of information respondents provide. Based on these studies, we found that a mail survey approach meets all three of these needs for surveying shore and private boat anglers.
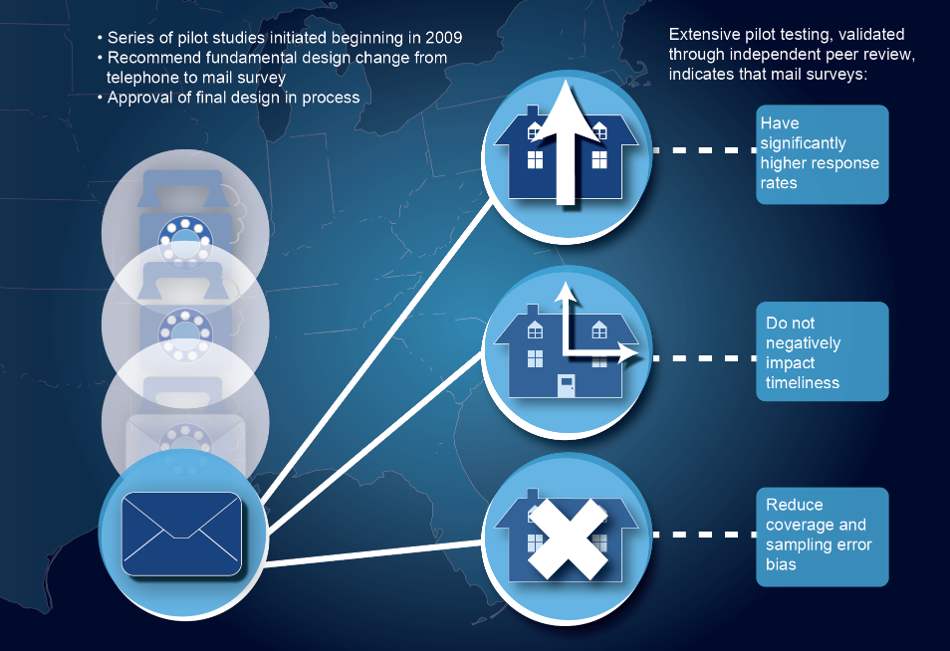
Mail surveys instead of telephone surveys: Our research has clearly indicated that mail surveys get a better response rate than telephone surveys, and that the information we receive is more thorough and accurate. We have also found that mail can be as timely and cost-effective as necessary to meet the needs of scientists, stock assessors, and managers.
National Saltwater Angler Registry (NSAR): In 2011, MRIP launched the Registry, which is a database of recreational fishermen living in the U.S. The information in the NSAR comes mostly from state-based saltwater fishing license and registration programs. Using the NSAR makes our surveys more efficient because we know we are contacting angling households. We also use a U.S. Postal Service database of virtually every household in the United States to make sure we are able to contact anglers not registered.
Learn more about how MRIP is improving surveys of fishing effort here.
Estimation methods
When the NRC conducted its review of MRFSS, one of its findings was that there had been a “mismatch” between the way we were gathering catch information and the way we were using that information to estimate catch. This discrepancy introduced the potential for bias in our estimates. As described in the Re-estimation section, one of the first major initiatives of MRIP was to develop a new way of calculating our estimates based on the catch survey protocols that were in use at the time.
Simultaneously, we worked to develop a new method for sampling fishermen for our catch surveys that is “design-unbiased,” removing the need for corrections. The new method was implemented in early 2013.
Re-estimation
In the review of the National Research Council, it was noted that the MRFSS catch estimation method was not correctly matched with the catch survey design, leading to potential bias in the estimates. In 2011, MRIP finalized a new design for calculating recreational catch. In doing so, MRIP corrected assumptions about how different factors might affect catch rates, and created a mathematical formula to address those issues.
This new method was used to recalculate previous estimates dating back to 2004, and served as the basis for new estimates moving forward until the new angler catch survey protocols were implemented in 2013. Those protocols corrected the potential biases resulting from the “mismatch” identified by the NRC.
What was the difference between the old and new numbers?
There were no across-the-board trends either in size or direction of change in the estimates. On a species-by-species basis, some estimates went up, some went down, and some remained about the same. In all cases, the re-estimated numbers are more accurate because we have removed potential sources of bias from the estimation design.
To learn more, you can watch our Re-estimating Catch video.
Calibration
When we implement improvements to our survey designs, there is a likelihood that the estimates generated from our previous methods will be different than the estimates resulting from the improvement. In certain cases, such as with the re-estimation using updated methods, the opportunity exists to compare one set of estimates vs. another side by side. In other cases, as with the re-design of our catch surveys, resources and logistics make it impossible to do complete side-by-side comparisons.
In either case, differing numbers pose a challenge to fisheries scientists and managers. For instance, if we see a marked increase or decrease in catch rates or numbers of fishing trips from one data collection design to another, it is important to determine whether the result of the change is due to an actual change in a fishery, or simply a reflection of the fact that we’re doing a better job of monitoring activity.
Depending on numerous factors, stock assessors, fisheries scientists, and managers may find it necessary to use a calibration factor to adjust historical numbers. This is a mathematical approach to treating two different sets of numbers in a comparable way.
In the case of the re-estimation, where estimates dating back to 2004 were adjusted, a workshop was held to determine the best way to address the differences between the new numbers and the old ones. The complete workshop report is available here, but in short, the participants agreed that whenever new stock assessments are conducted, it is important to use a calibration factor to adjust catch estimates for years earlier than 2004 to be comparable to the estimates made for 2004 and after using the new estimation method.
Similarly, work is being done to determine if there is a need to apply calibration methods to numbers generated by our new catch estimation methods. If the need exists, a similar process will be followed to determine the most appropriate calibration factors.