|
The International Group for
Marine Ecological Time Series
|
|
 |
WORLD (all) N+S ATL - N. Atlantic - Baltic - Mediterranean - S. Atlantic N+S PAC - N. Pacific - S. Pacific INDIAN ARCTIC SOUTHERN |
 |
ZOOM TW05 TW10 TW15 FULL TW05 TW10 TW15 |
 |
 |
 |
||||
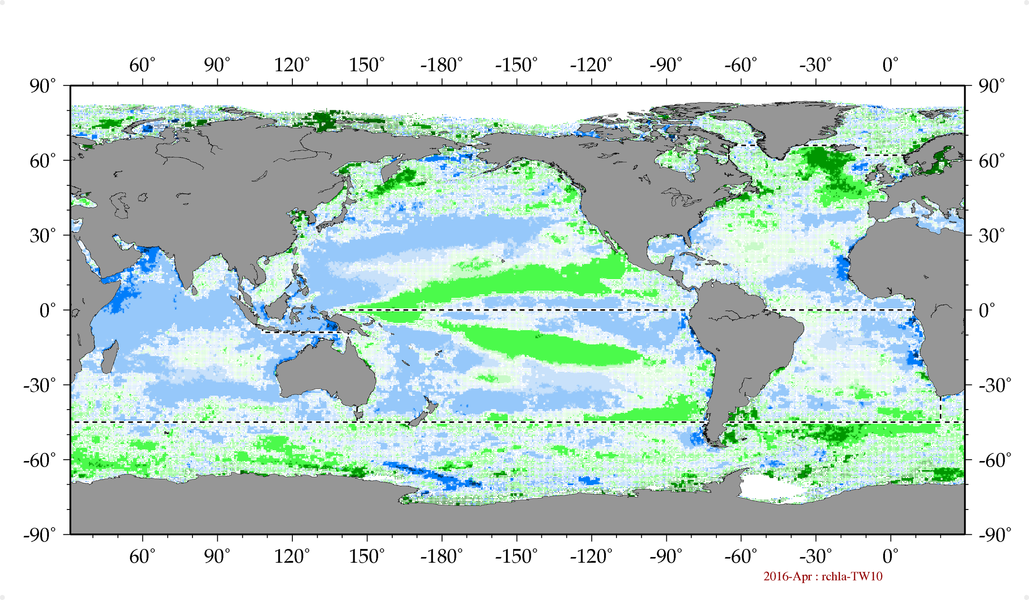
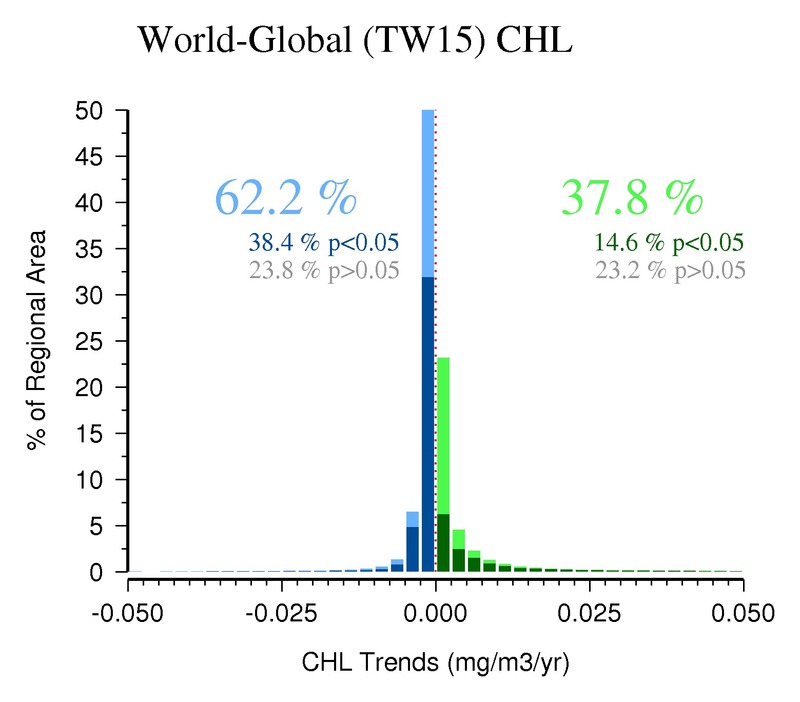
| Latitude-adjusted CHL data field surface area = 362.3 million km2 |
05-Year (2008-2012) | 10-Year (2003-2012) | 15-Year (1998-2012) |
20-Year (1993-2012) | 25-Year (1988-2012) | 30-Year (1983-2012) |
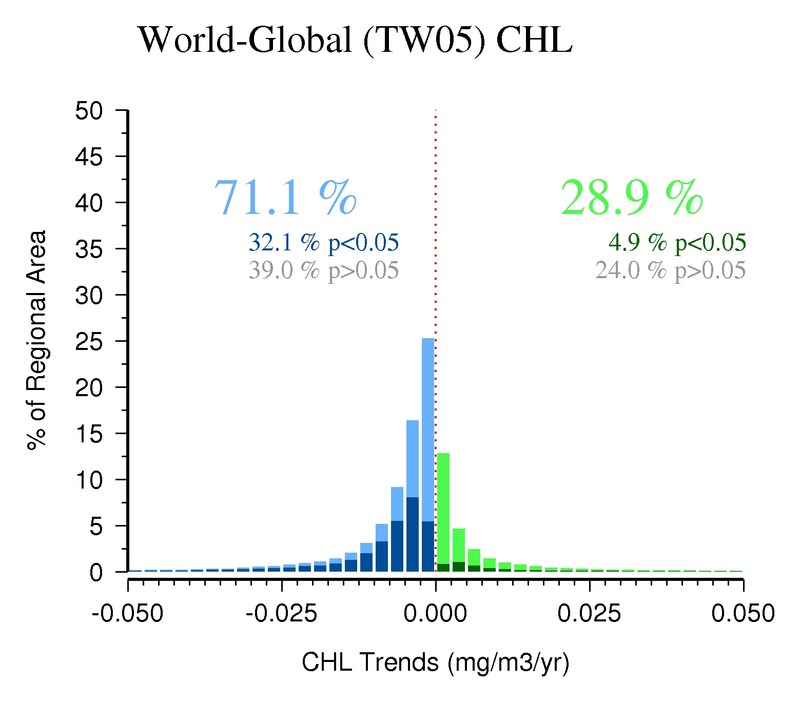
( p<0.05 ) |
( 4.9% ) |
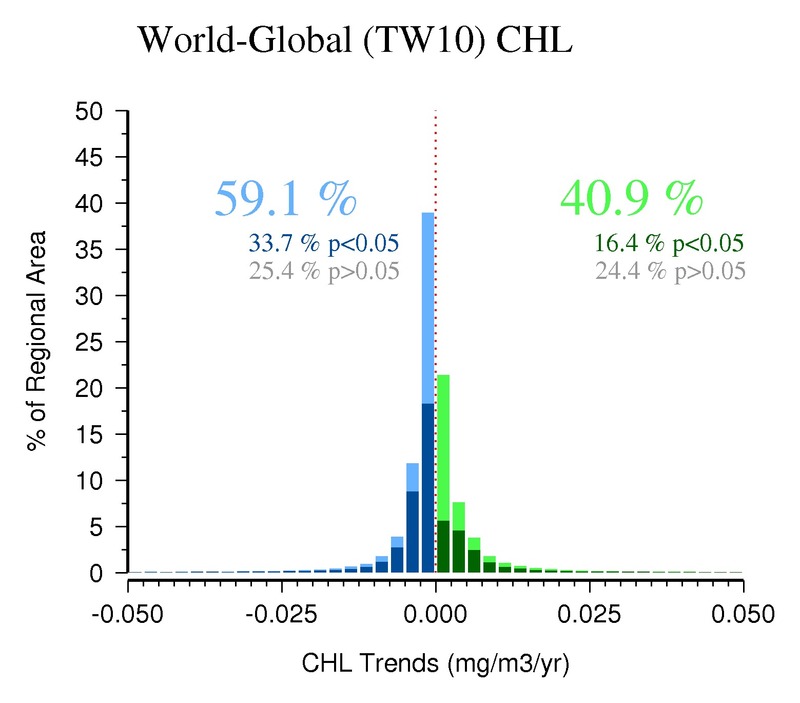
( 16.4% ) |
( 14.6% ) |
|||
( p<0.05 ) |
( 32.1% ) |
( 33.7% ) |
( 38.4% ) |
|||
| > 0.50 mg/m3/decade (increasing)
( p<0.05 ) |
( 0.6% ) |
( 0.5% ) |
( 0.8% ) |
|||
| 0.10 to 0.50 mg/m3/decade (increasing)
( p<0.05 ) |
( 1.4% ) |
( 2.3% ) |
( 2.8% ) |
|||
| 0.01 to 0.10 mg/m3/decade (increasing)
( p<0.05 ) |
( 2.7% ) |
( 11.8% ) |
( 8.9% ) |
|||
| 0.00 to 0.01 mg/m3/decade (increasing)
( p<0.05 ) |
( 0.2% ) |
( 1.8% ) |
( 2.1% ) |
|||
| 0.00 to -0.01 mg/m3/decade (decreasing)
( p<0.05 ) |
( 0.8% ) |
( 5.2% ) |
( 14.9% ) |
|||
| -0.01 to -0.10 mg/m3/decade (decreasing)
( p<0.05 ) |
( 21.4% ) |
( 25.7% ) |
( 22.8% ) |
|||
| -0.10 to -0.50 mg/m3/decade (decreasing)
( p<0.05 ) |
( 7.7% ) |
( 2.4% ) |
( 0.6% ) |
|||
| > -0.50 mg/m3/decade (decreasing)
( p<0.05 ) |
( 2.1% ) |
( 0.4% ) |
( 0.1% ) |
|||
Mon Oct 3 14:58:55 EDT 2016