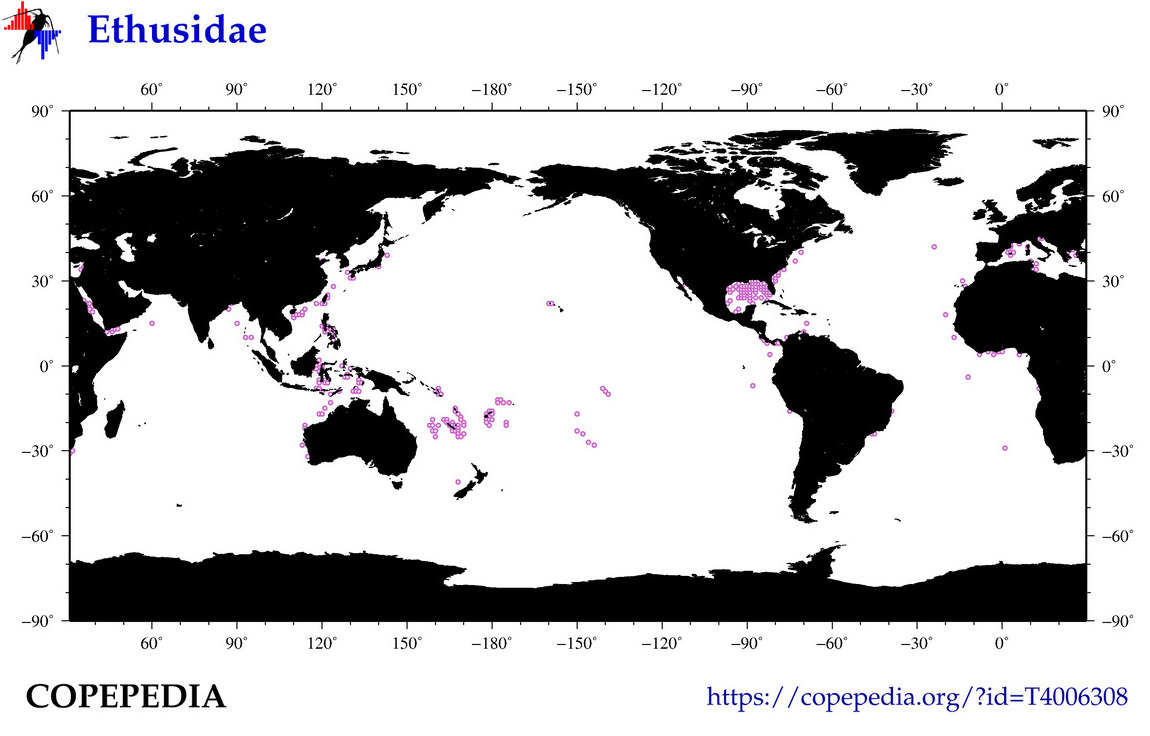
In the map above,
the DARK RED DOTS indicate locations of quantitative data (0 obs globally),
while pink dots indicate locations of "presence-only"/non-quantitative observations (757 obs globally). Yellow Stars show locations of any time series reporting this taxa or group (0 sites globally).
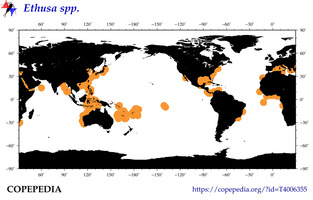
# of direct Siblings: 36
# (total) of all siblings-and-sub-siblings: 37
# of DB-records (self+all-sibs): 0
# of non-Quantitative records (self+all-sibs): 590
# of Time Series sites (self+all-sibs): 0
# of Barcodes (self+all-sibs): 3
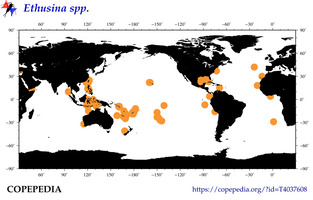
# of direct Siblings: 29
# (total) of all siblings-and-sub-siblings: 29
# of DB-records (self+all-sibs): 0
# of non-Quantitative records (self+all-sibs): 194
# of Time Series sites (self+all-sibs): 0
# of Barcodes (self+all-sibs): 0
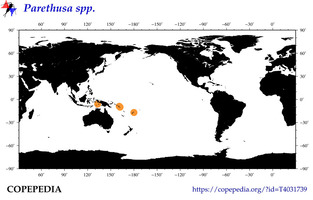
# of direct Siblings: 2
# (total) of all siblings-and-sub-siblings: 2
# of DB-records (self+all-sibs): 0
# of non-Quantitative records (self+all-sibs): 4
# of Time Series sites (self+all-sibs): 0
# of Barcodes (self+all-sibs): 1
no photos currently available
COPEPEDIA is an in-development project.
These web pages are currently under construction and expansion.
[ About COPEPEDIA ]