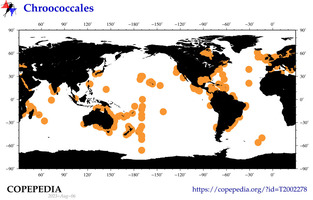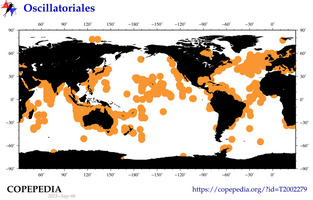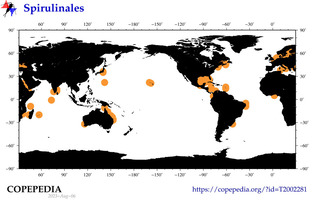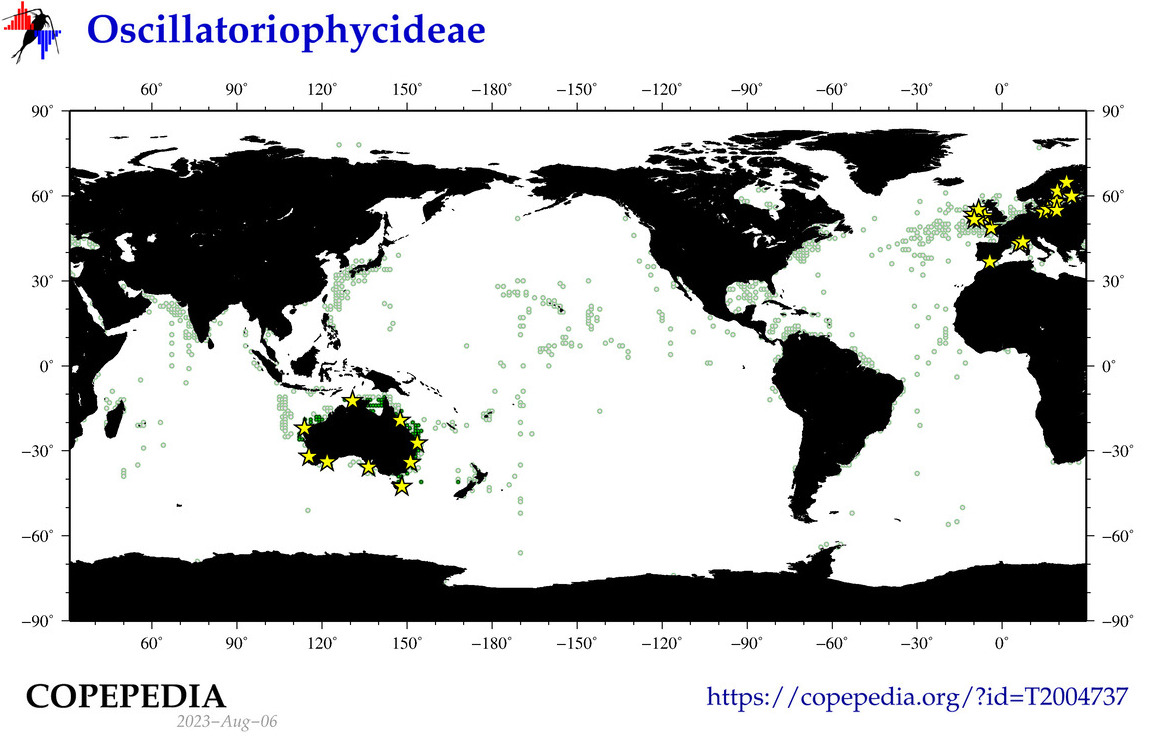
In the map above,
the DARK GREEN DOTS indicate locations of quantitative data ( obs globally),
while light-green dots indicate locations of "presence-only"/non-quantitative observations ( obs globally).
Yellow Stars show locations of any time series reporting this taxa or group ( sites globally).
|
|
|
|
The photos above are of this taxon and its taxonomic siblings.
Click on the photobox to see a gallery of all the photos.
|
This Subclass currently has 3 taxonomic siblings (listed below) and an expanded tree of 198 members (self + siblings + sub-siblings).
Want to see an alphabetical list of ALL
families or
genera or
species
within this taxa group? Click on the blue (text) link to the left.
|