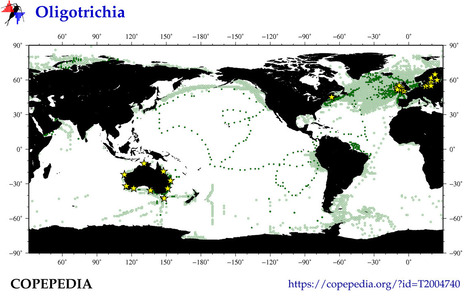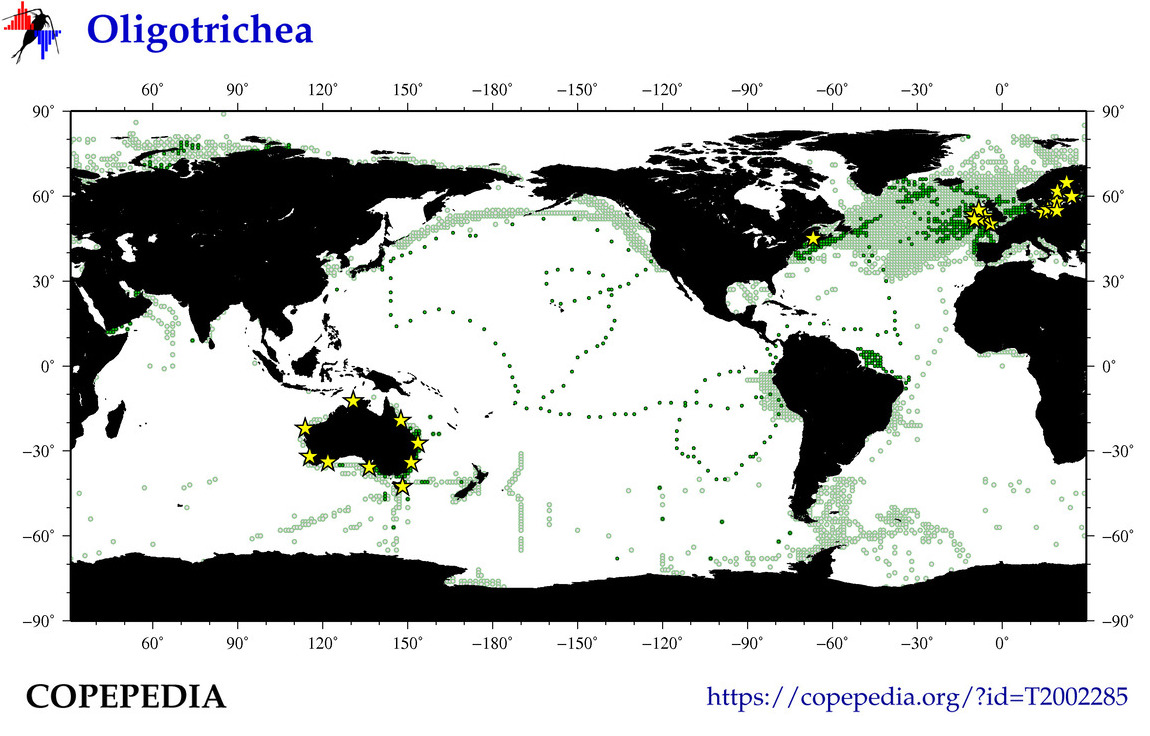
In the map above,
the DARK GREEN DOTS indicate locations of quantitative data (1658 obs globally),
while light-green dots indicate locations of "presence-only"/non-quantitative observations (61921 obs globally).
Yellow Stars show locations of any time series reporting this taxa or group (222 sites globally).
|
|
|
|
The photos above are of this taxon and its taxonomic siblings.
Click on the photobox to see a gallery of all the photos.
|