|
|
The Time-Series Toolkit
An online plankton time-series analysis and visualization toolkit.
How to make a COPEPODITE-readable CSV data file |
|
Data Format Instructions: |
|
General Data Layout and Format Concept: COPEPODITE can only read your uploaded time-series data if it is in a simple,keyword-labeled, comma-delimited ("comma separated values") CSV format. This format can be generated by Excel and many other database/statistical/spreadsheet programs, but will confuse COPEPODITE if you also use commas in your column headers or as a decimal place in the numbers (e.g., the value of "1/4" should be represented as "0.25" and not "0,25"). The COPEPODITE data format consists of a single row of "column headers", the pink-colored first row in the table shown below, followed by multiple rows of date and/or data values. In this column header row, the bold text are recognized Date or Variable Indicators. Format Rule #1: The very first row must contain the column labels (e.g., DATE-YMD, ABND=, BIOM=, TEMP=, ...). Format Rule #2: The very first column must be a date column (e.g., DATE-YMD, DATE-MDY, or DATE-DMY). Formatting Hints, Tips, and Tricks: The purpose of the "#" ignore option is to allow you to quickly "remove/restore" anomalous values from a data file without permanently removing them. If you remove the value instead, it will be harder to restore it in the future. This on/off toggle lets you play around with large/small values to see how they influence the analysis results. ... ... ... Data Format instructions continue after the table below ... ... |
| # Comments | Because the very first character on this line is "#", the ENTIRE row will be ignored by COPEPODITE. . You can use this row for comments and notes. | |||||
| 2005-10-27 | 532 | Oct/26/2005 | 105 | 352 | 21_10_2005 | 19 |
| 2005-10-28 | 400 | Oct/27/2005 | 400 | 25_10_2005 | 21 | |
| 2005-10-29 | Oct/28/2005 | 217 | 183 | 26_10_2005 | 20 | |
| 2005-11-01 | 319 | Oct/29/2005 | 50 | 117 | 03_11_2005 | 17 |
| #2005-11-05 | entire row ignored 1010 | Oct/29/2005 | entire row ignored 173 | entire row ignored 532 | 05_11_2005 | entire row ignored 19 |
| 2005-11-07 | # lost sample | Oct/29/2005 | 173 | # -100.25 (??) | 05_11_2005 | 19 |
| 2005-11-17 | 971 | Nov/03/2005 | 140 | 817 | 07_11_2005 | 18 |
|
DATE columns and Date Formats: The current version of COPEPODITE has base time unit is "monthly means". This means that if you provide weekly or daily data, it will be binned and averaged into a single monthly value for that month of that year. It is quite common to have different sampling intervals (dates) for the plankton than for the other variables. You might have monthly or seasonal zooplankton date, weekly chlorophyll data, and perhaps daily temperature data. COPEPODITE will read all of these and correctly match up and synchronzie the data for you (currently to monthly bins). In the example table above, the biomass data and abundance data and temperature data all have different sampling dates (and formats). The COPEPODITE software will bin them into monthly means and then synchronize them into matching month+year date sets. (This means the temperature data, although taken on different days, will sync with the corresponding biomass and abundance data for that month!). Format Rule #3: Each column of data values is uses the date column found to its left. You can have a single date column with 15 data columns following it, or you can have 15 paired "date + data" column pairs, or any mixture you desire. (These date columns can also have different date formats.) The general idea is to make your set up of the data file as easy as possible. Format Rule #4: COPEPODITE currently only recognizes three general data formats:
Format Rule #5: Your date format must remain consistent within each individual date column (ie, do not switch from YMD to MDY or DMY within a single date column). You may have multiple different date format COLUMNS in the spreadsheet (like the table above).
|
|
DATA (variable) columns Types: All COPEPODITE data columns must be labeled with a recognized variable indicator (e.g., "BIOM=", "ABND=", "ABND5=", ...). The text to the right of the "=" symbol can be whatever you desire, and that text will be used to describe the variable in column (e.g., "BIOM= Total Wet Mass (mg/m3)", "BIOM= Total Dry Mass (mg/m3)"). This text will also be used in all of the plots and figures showing the variable (e.g., "TCOP" or "Total Copepods (#/m3)" will be shown in the plot titles. Please make that your variable text does not contain any commas (e.g., Do not use "ABND= Calanus finmarchicus, adults, , female"). These extra commas will corrupt the comma-separated-values data format and cause your data to fail the preview step. Also, at this time please do not include any Greek or mathematical symbols (e.g., the degrees symbol or the "u" ("mu" or micro) symbol), as they will cause the header text to get cut short (the rest of the description text will not be shown in the plots). (This latter issue is a problem with the web server not liking non-standard-ASCII characters.) Format Rule #6: COPEPODITE currently only recognizes these Variable Indicators:
Format Rule #7: Your data values can NOT already be "log transformed". (If they are, reverse the values back to non-transformed.) The Toolkit will log-transform (or not) depending on value type and/or the analysis you have selected. The WGZE/WG125/WGPME plots use log-transform biological and nutrient values, while the "PSR-2018" plots do not. |
|
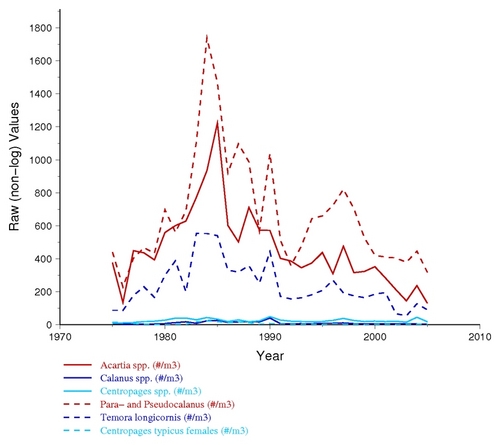
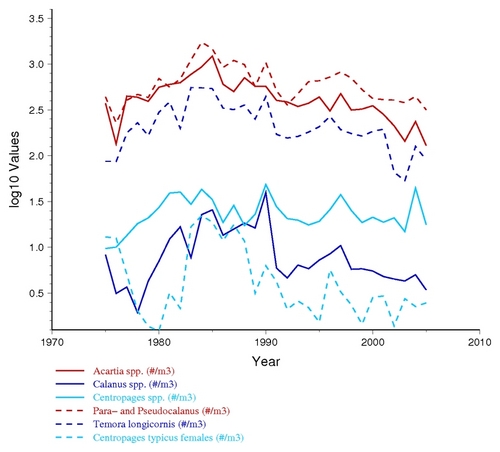
Special Grouping Options: Currently the COPEPODITE "group plot" is focused on allowing a user to plot multiple years of taxa (ABND=) or nutrient variables (LOTH=) together in a single plot. This is done by identifying the group membership with a one digit number (e.g., the "ABND1=" column header in the example table earlier in this document indicates "Group 1"). Any taxa data associated with "ABND1=" will be plotted in a separate graph from "ABND2=" (e.g., so you could plot "copepods species" using ABND1= and "diatom species" using ABND2= ). Currently, different variable types do not cross-group (e.g., "ABND1=" and "ABDT1=" and "BIOM1=" and "TEMP1=" have the same number but are actually treated and plotted as completely different groups.) For biological and nutrient values, the Group Plots are shown in both "log10" and "raw" value format (see examples below), because the results and usefulness of either plot depends on the data, the distribution of values, and what you are looking for within the data. Below are examples of the same zooplaknton data plotted in both "log10" and "raw" format.
|

