Multi-Variable Comparison & Correlation Plot (MVCCP)
Checked variables will have their figure shown below. Uncheck any variable to remove its plot from below.
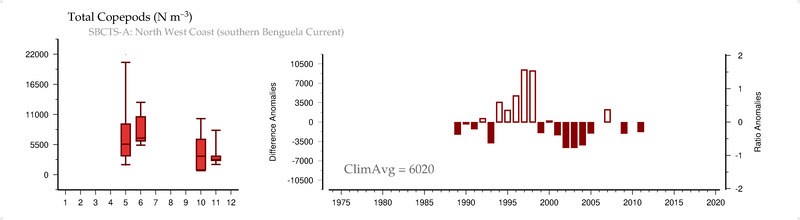
Total Copepods (#/m3)
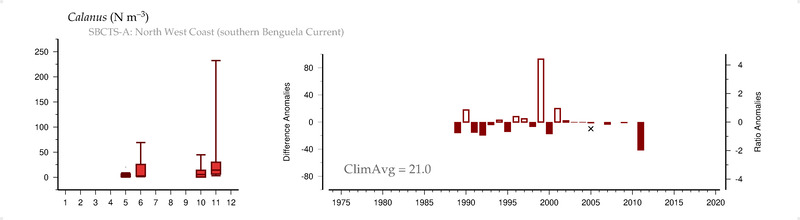
Calanus (#/m3)
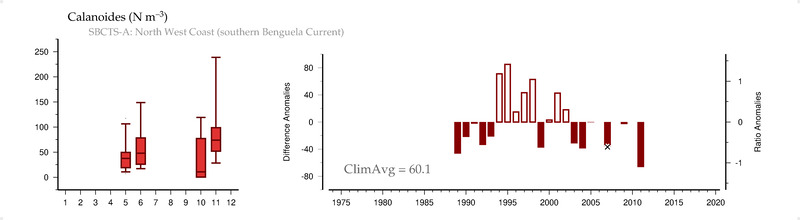
Calanoides (#/m3)
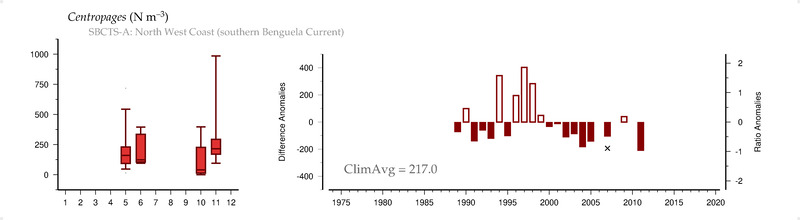
Centropages (#/m3)
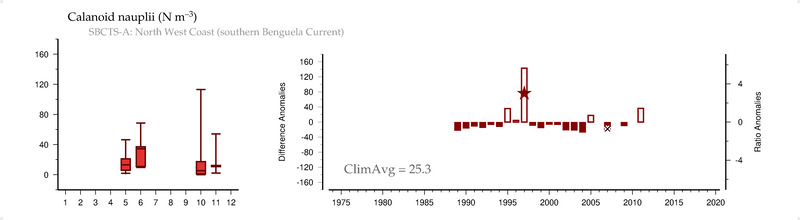
Calanoid nauplii (#/m3)
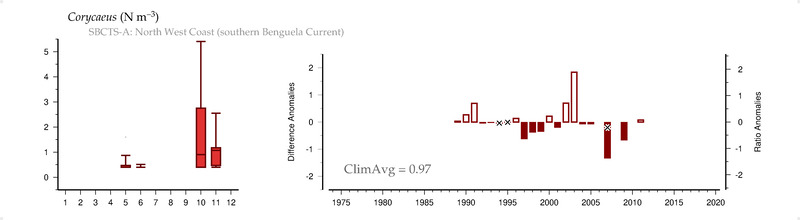
Corycaeus (#/m3)
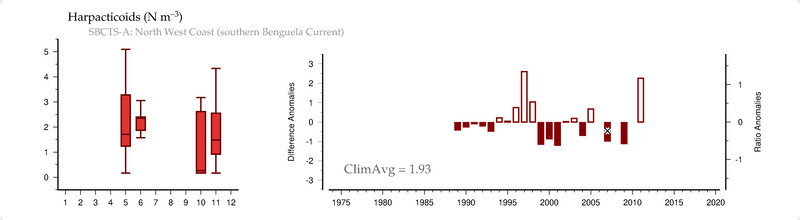
Harpacticoids (#/m3)
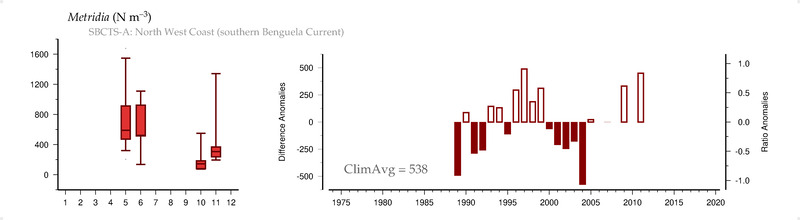
Metridia (#/m3)
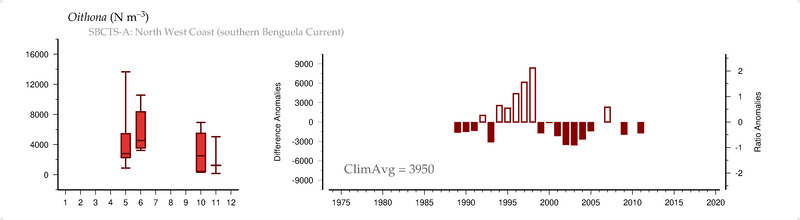
Oithona (#/m3)
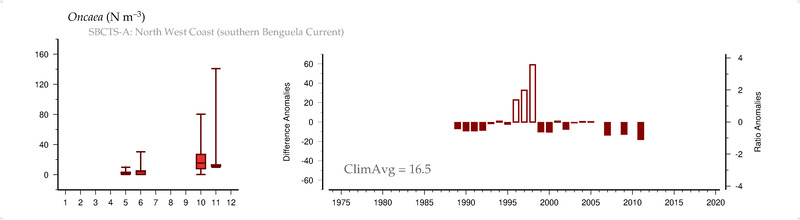
Oncaea (#/m3)
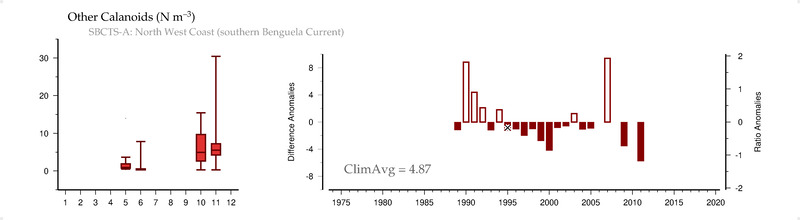
Other Calanoids (#/m3)
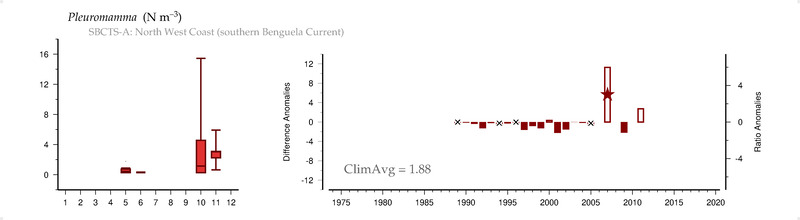
Pleuromamma (#/m3)
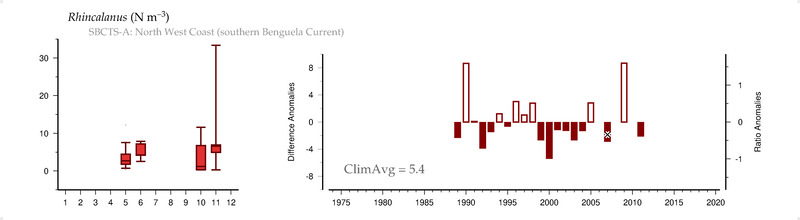
Rhincalanus (#/m3)
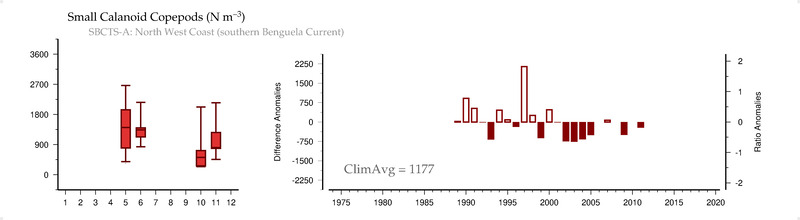
Small Calanoid Copepods (#/m3)
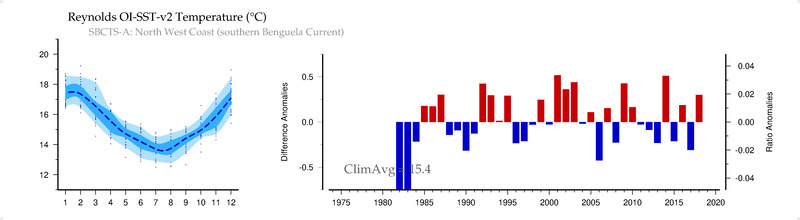
Reynolds OI-SST-v2 Temperature (C)
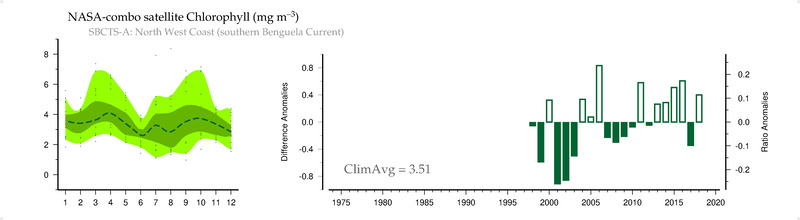
NASA-combo satellite Chlorophyll (mg/m3)
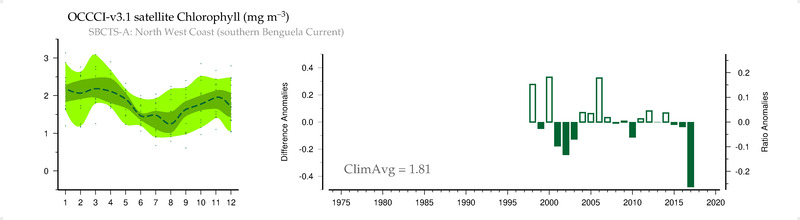
OCCCI-v3.1 satellite Chlorophyll (mg/m3)
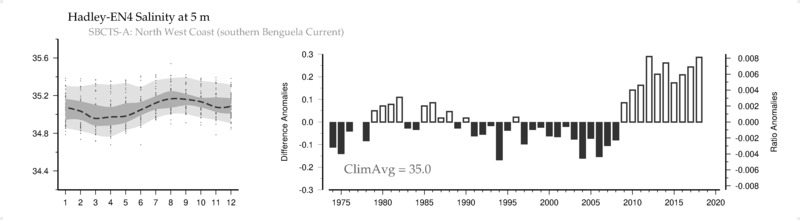
Hadley-EN4 Salinity () at 5 m
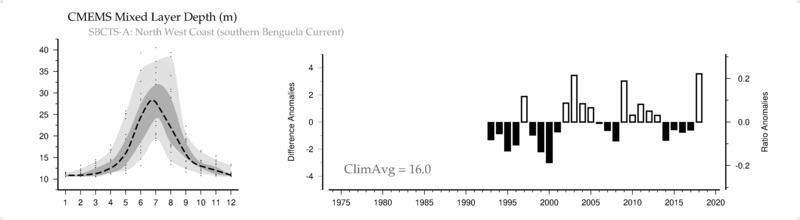
CMEMS Mixed Layer Depth (m)
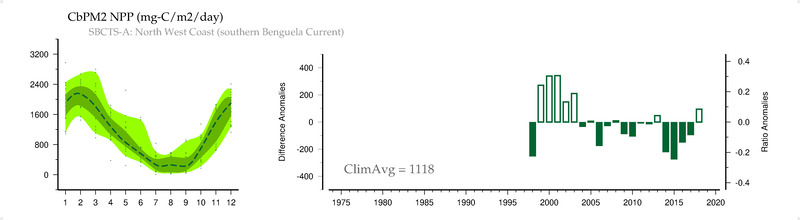
CbPM2 NPP (mg-C/m2/day)
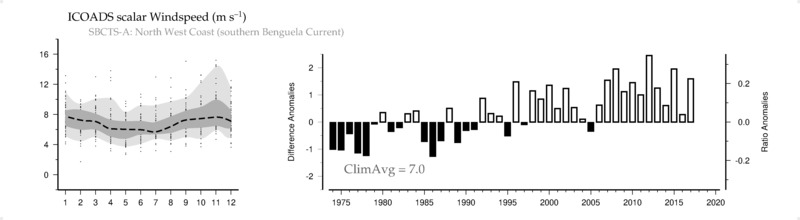
ICOADS scalar Windspeed (m/s)
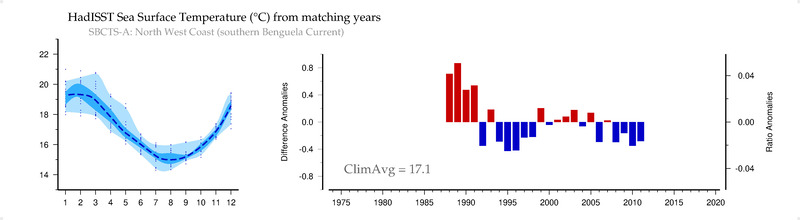
HadISST Sea Surface Temperature (C) from matching years
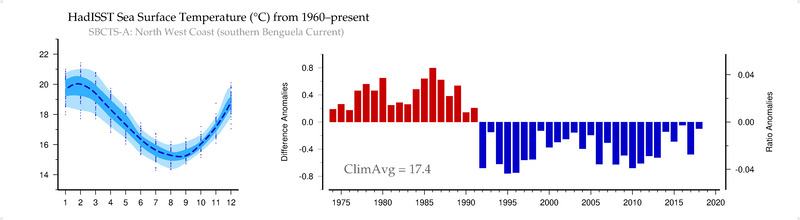
HadISST Sea Surface Temperature (C) from 1960-present
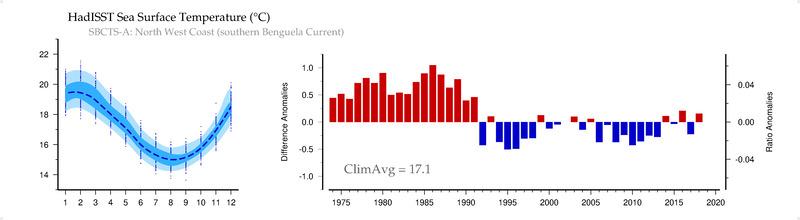
HadISST Sea Surface Temperature (C)