Multi-Variable Comparison & Correlation Plot (MVCCP)
Checked variables will have their figure shown below. Uncheck any variable to remove its plot from below.
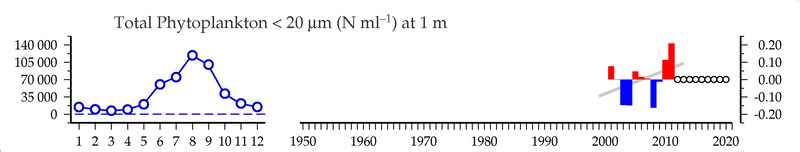
Total Phytoplankton < 20 um (cells/ml) at 1 m
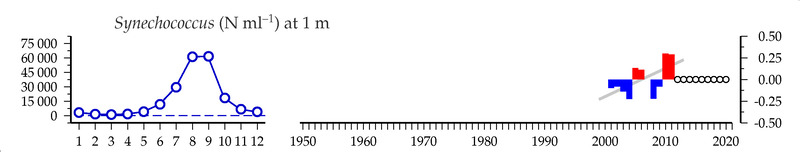
Synechococcus (cells/ml) at 1 m
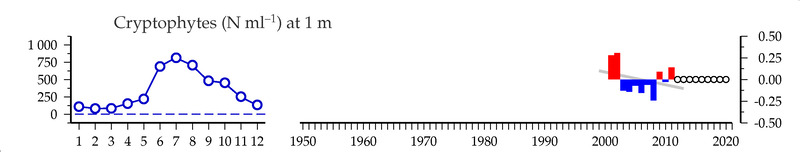
Cryptophytes (cells/ml) at 1 m
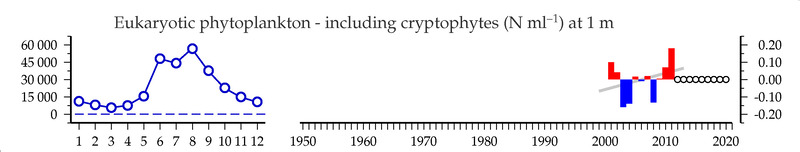
Eukaryotic phytoplankton - including cryptophytes (cells/ml) at 1 m
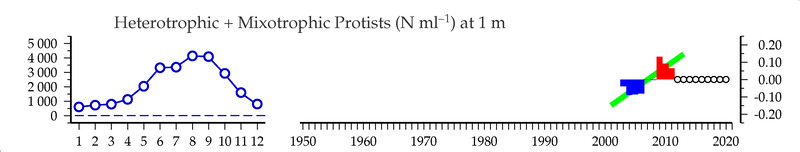
Heterotrophic + Mixotrophic Protists (cells/ml) at 1 m
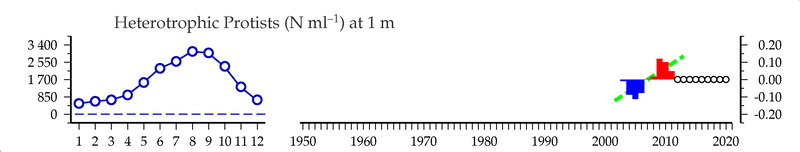
Heterotrophic Protists (cells/ml) at 1 m
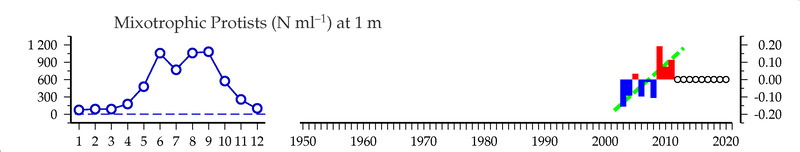
Mixotrophic Protists (cells/ml) at 1 m
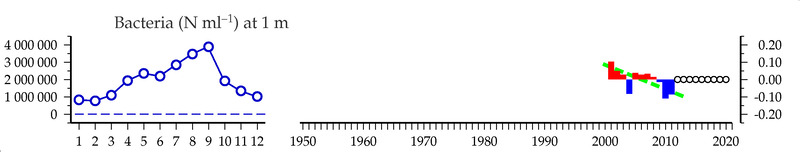
Bacteria (#/ml) at 1 m
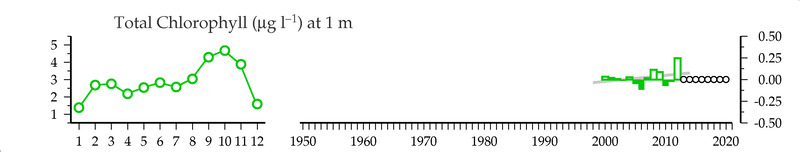
Total Chlorophyll (ug/L) at 1 m
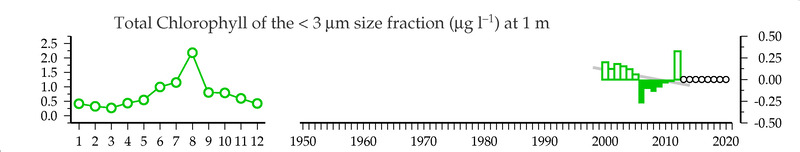
Total Chlorophyll of the < 3 um size fraction (ug/L) at 1 m
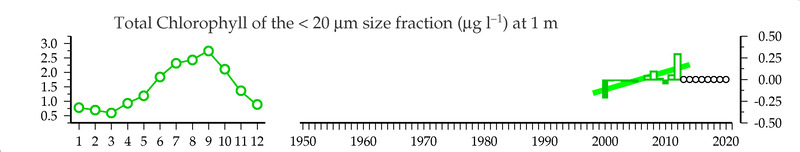
Total Chlorophyll of the < 20 um size fraction (ug/L) at 1 m
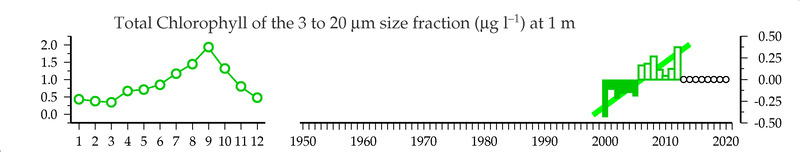
Total Chlorophyll of the 3 to 20 um size fraction (ug/L) at 1 m
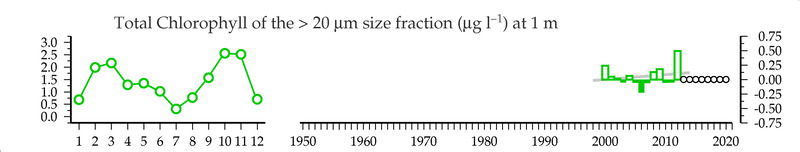
Total Chlorophyll of the > 20 um size fraction (ug/L) at 1 m
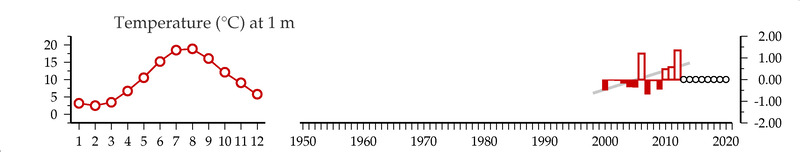
Temperature ( C ) at 1 m
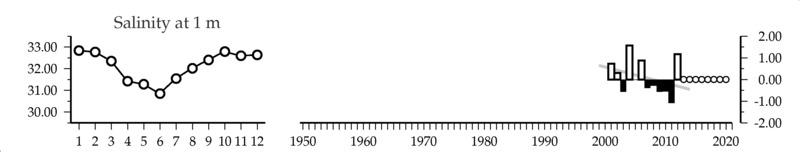
Salinity (psu) at 1 m
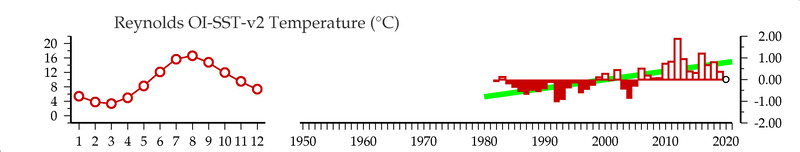
Reynolds OI-SST-v2 Temperature (C)
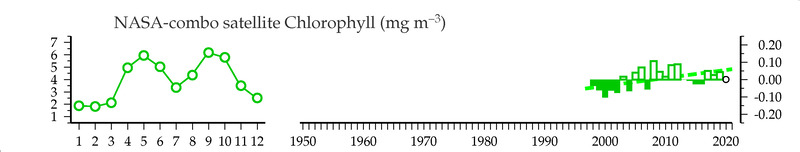
NASA-combo satellite Chlorophyll (mg/m3)
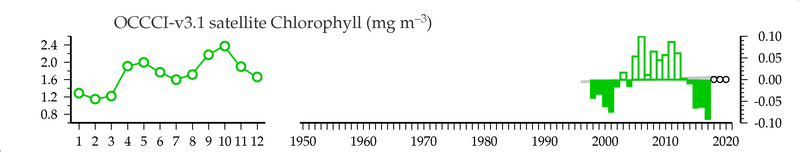
OCCCI-v3.1 satellite Chlorophyll (mg/m3)
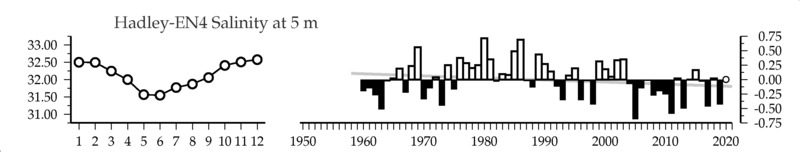
Hadley-EN4 Salinity () at 5 m
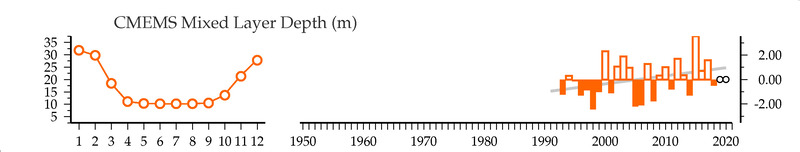
CMEMS Mixed Layer Depth (m)
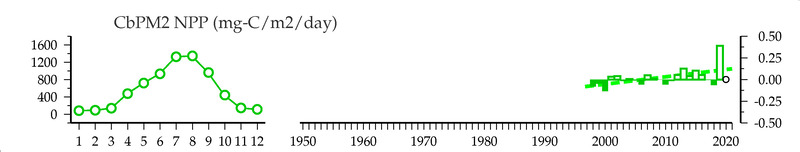
CbPM2 NPP (mg-C/m2/day)
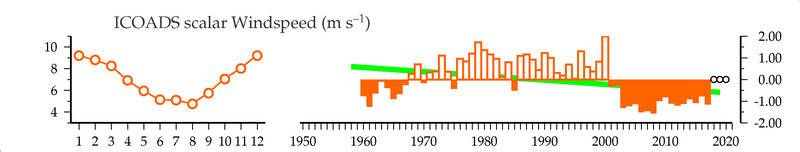
ICOADS scalar Windspeed (m/s)
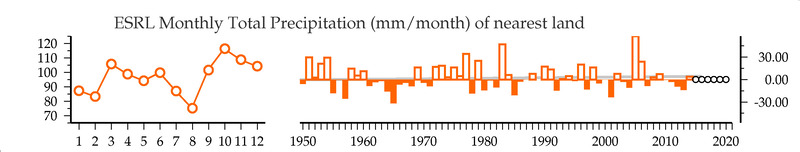
ESRL Monthly Total Precipitation (mm/month) of nearest land
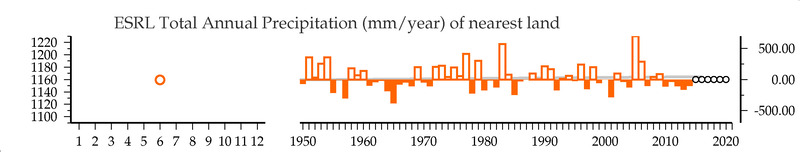
ESRL Total Annual Precipitation (mm/year) of nearest land
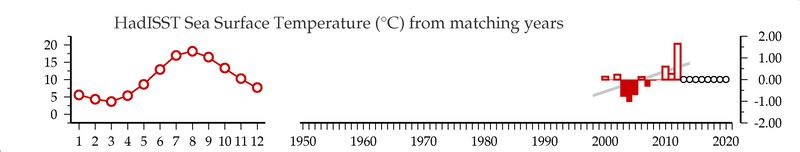
HadISST Sea Surface Temperature (C) from matching years
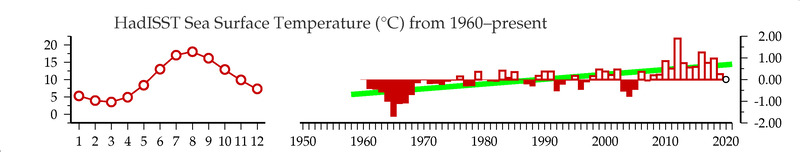
HadISST Sea Surface Temperature (C) from 1960-present
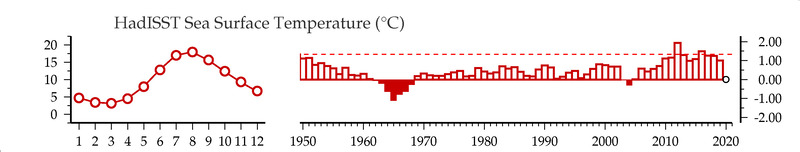
HadISST Sea Surface Temperature (C)
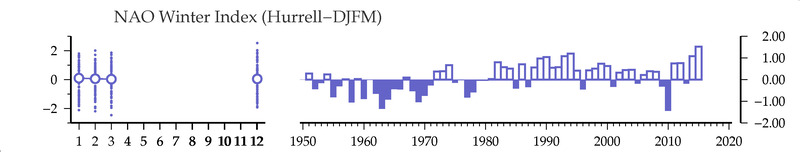
NAO Winter Index
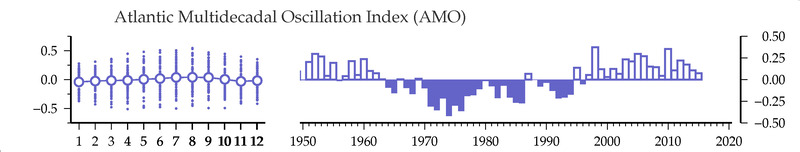
Atlantic Multidecadal Oscillation Index
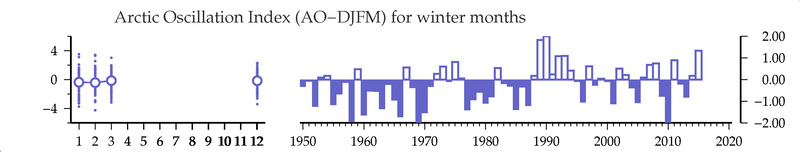
Arctic Oscillation Index (winter months)
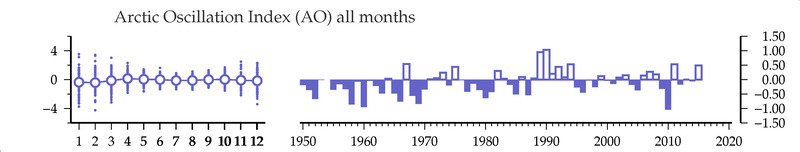
Arctic Oscillation Index
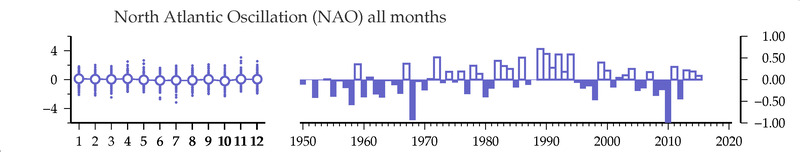
North Atlantic Oscillation