Multi-Variable Comparison & Correlation Plot (MVCCP)
Checked variables will have their figure shown below. Uncheck any variable to remove its plot from below.
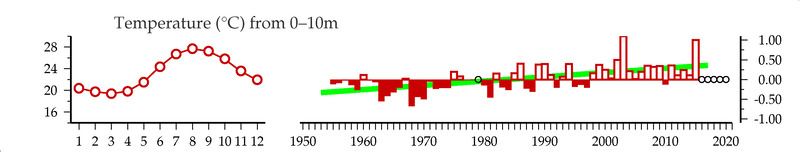
Temperature ( C ) from 0-10m
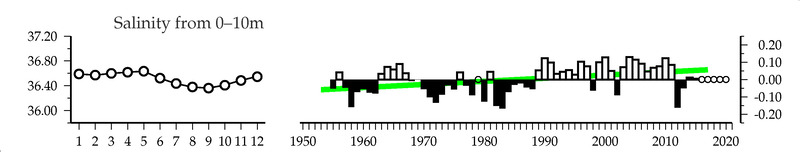
Salinity () from 0-10m
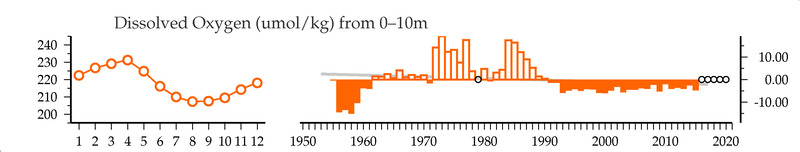
Dissolved Oxygen (umol/kg) from 0-10m
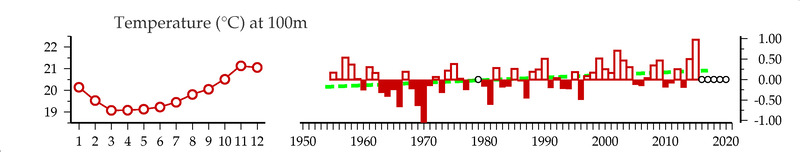
Temperature ( C ) at 100m
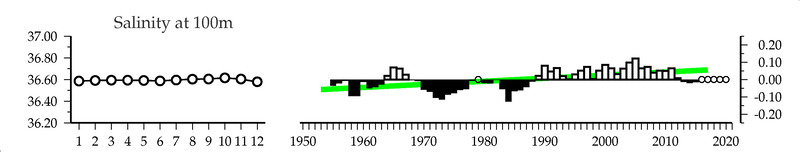
Salinity () at 100m
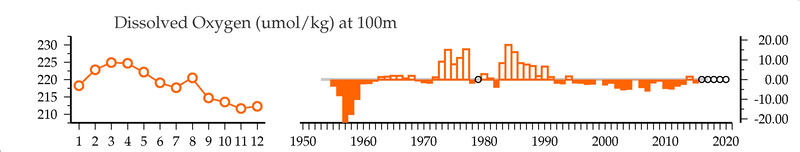
Dissolved Oxygen (umol/kg) at 100m
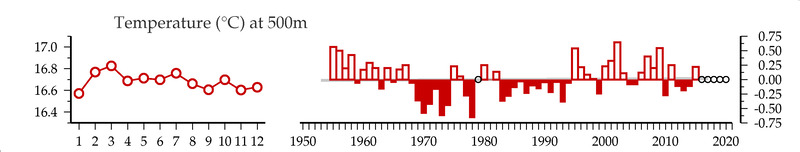
Temperature ( C ) at 500m
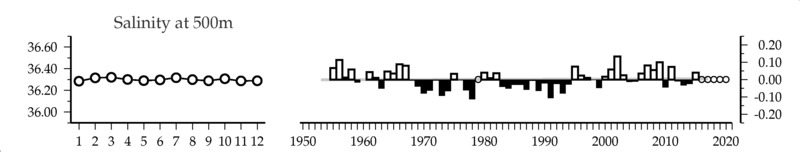
Salinity () at 500m
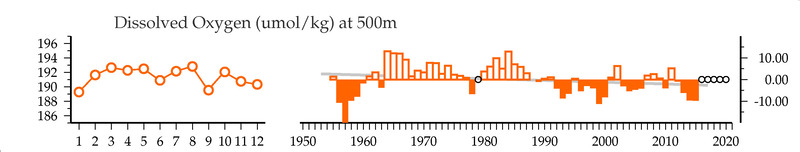
Dissolved Oxygen (umol/kg) at 500m
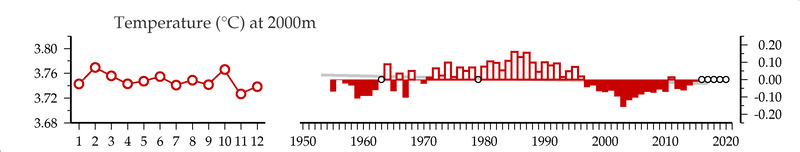
Temperature ( C ) at 2000m
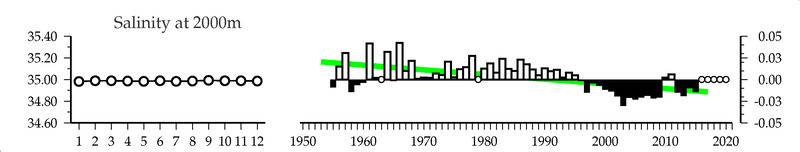
Salinity () at 2000m
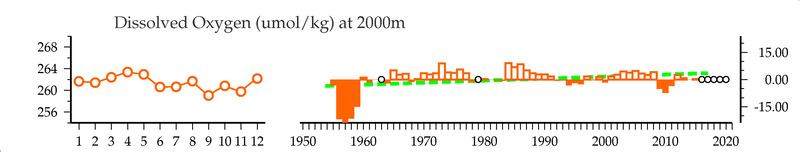
Dissolved Oxygen (umol/kg) at 2000m
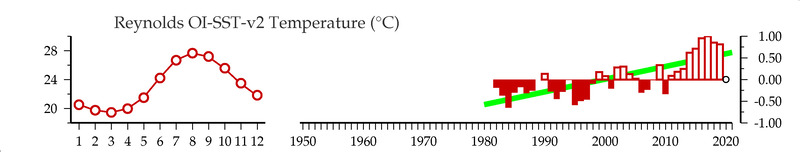
Reynolds OI-SST-v2 Temperature (C)
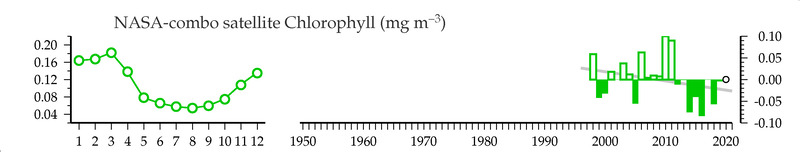
NASA-combo satellite Chlorophyll (mg/m3)
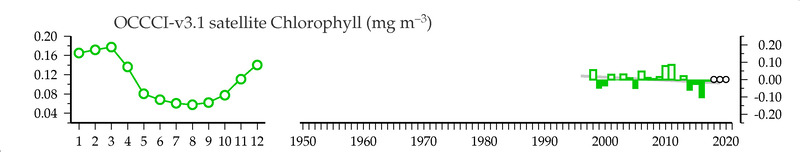
OCCCI-v3.1 satellite Chlorophyll (mg/m3)
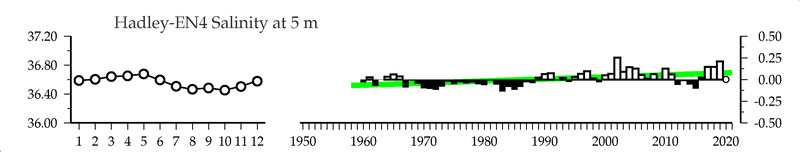
Hadley-EN4 Salinity () at 5 m
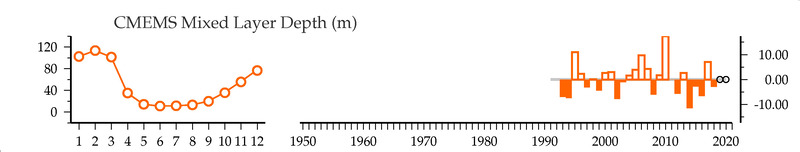
CMEMS Mixed Layer Depth (m)
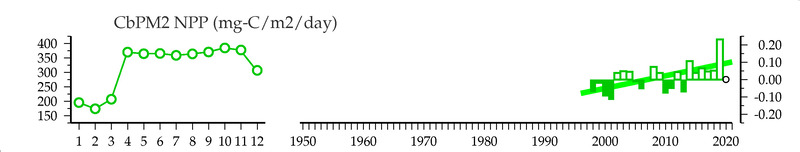
CbPM2 NPP (mg-C/m2/day)
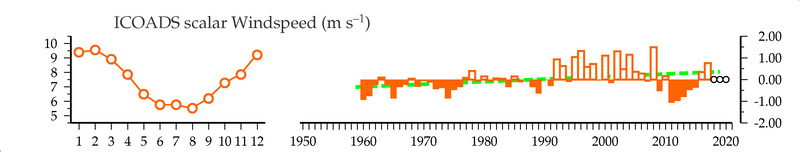
ICOADS scalar Windspeed (m/s)
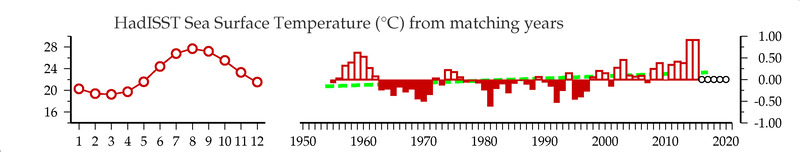
HadISST Sea Surface Temperature (C) from matching years
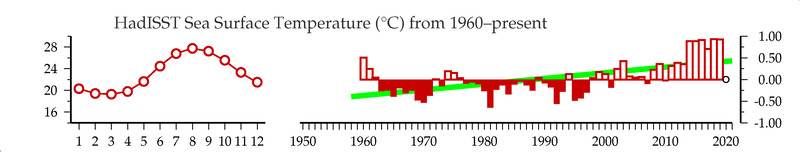
HadISST Sea Surface Temperature (C) from 1960-present
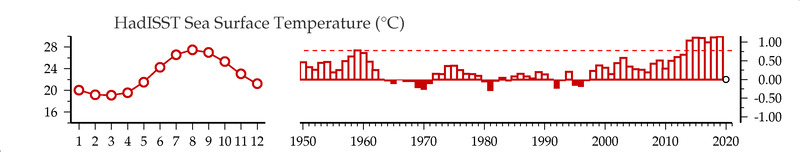
HadISST Sea Surface Temperature (C)
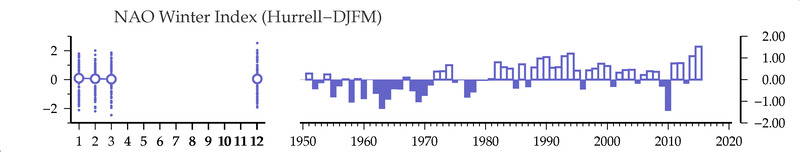
NAO Winter Index
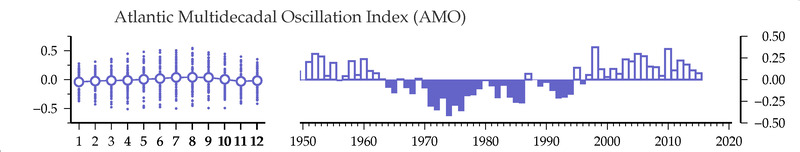
Atlantic Multidecadal Oscillation Index
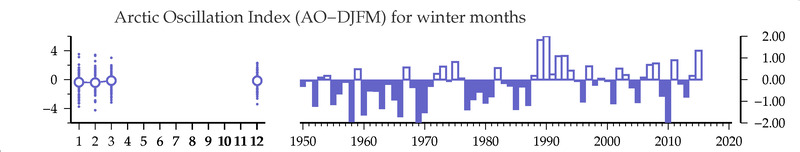
Arctic Oscillation Index (winter months)
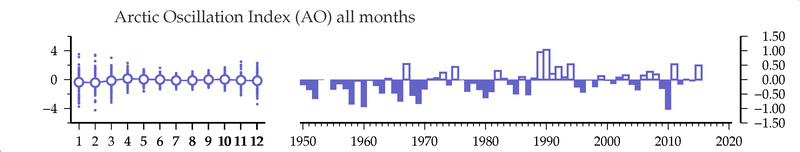
Arctic Oscillation Index
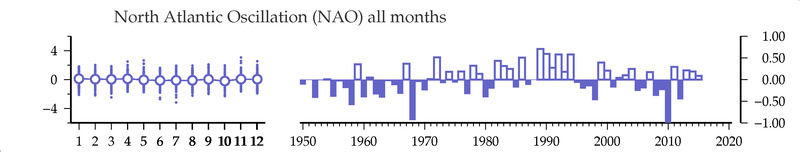
North Atlantic Oscillation