Multi-Variable Comparison & Correlation Plot (MVCCP)
Checked variables will have their figure shown below. Uncheck any variable to remove its plot from below.
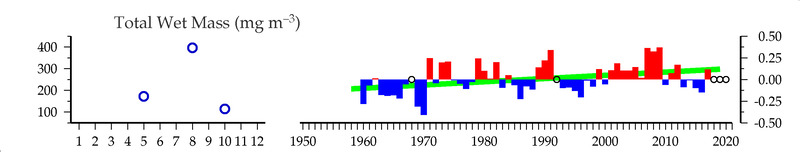
Total Wet Mass (mg/m3)
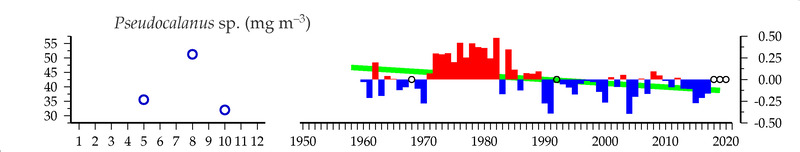
Pseudocalanus sp. (mg/m3)
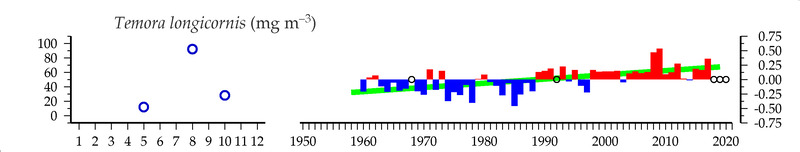
Temora longicornis (mg/m3)
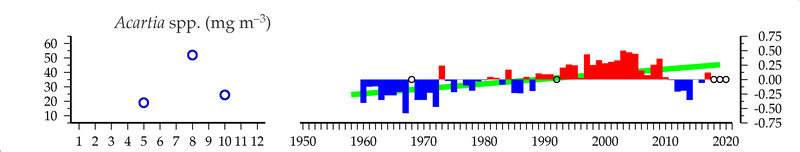
Acartia spp. (mg/m3)
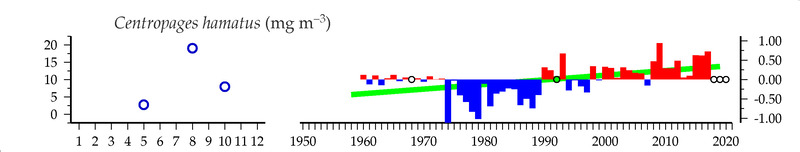
Centropages hamatus (mg/m3)
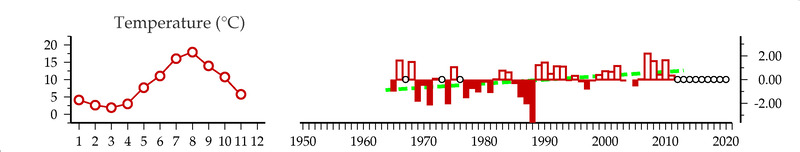
Temperature ( C )
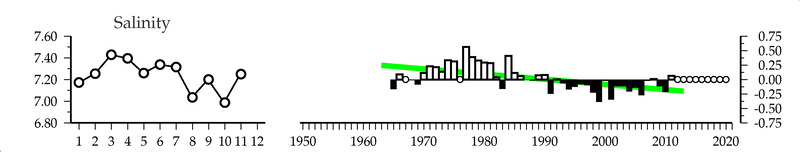
Salinity ()
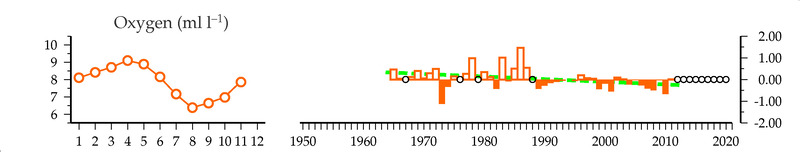
Oxygen (ml/l)
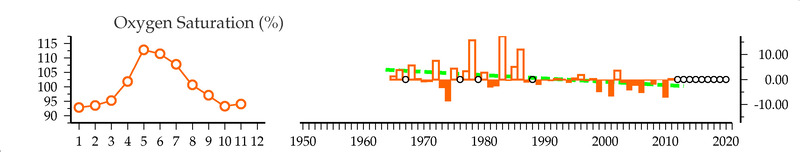
Oxygen Saturation (%)
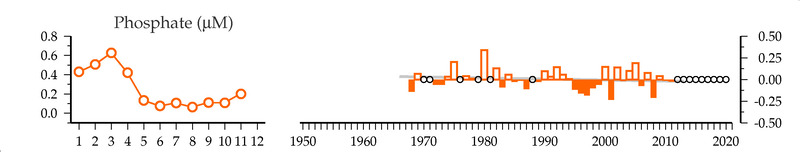
Phosphate (um)
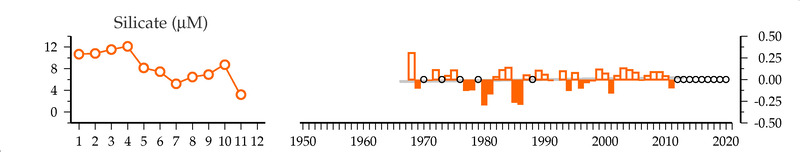
Silicate (um)
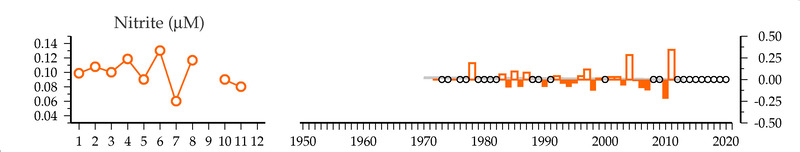
Nitrite (um)
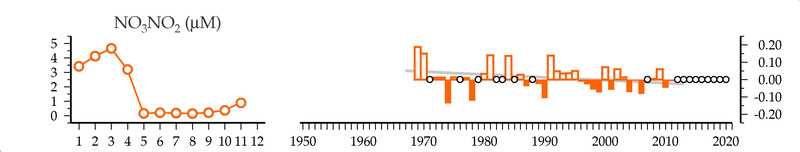
NO3NO2 (um)
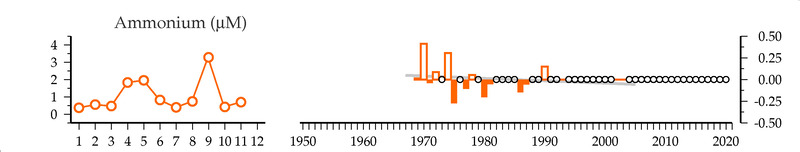
Ammonium (um)
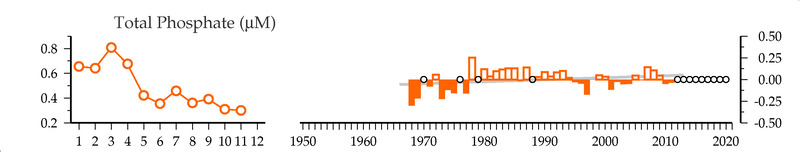
Total Phosphate (um)
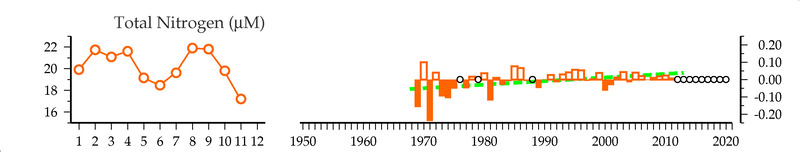
Total Nitrogen (um)
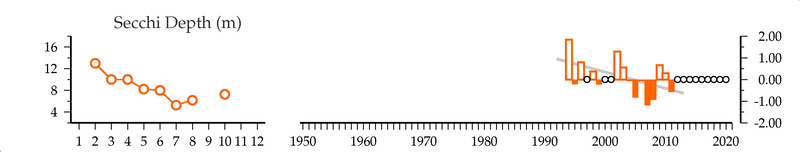
Secchi Depth (m)
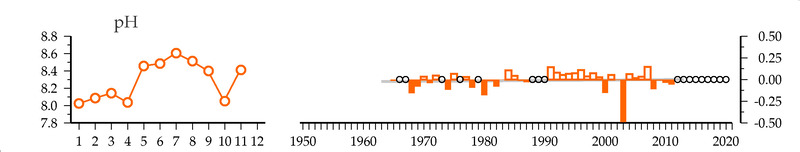
pH
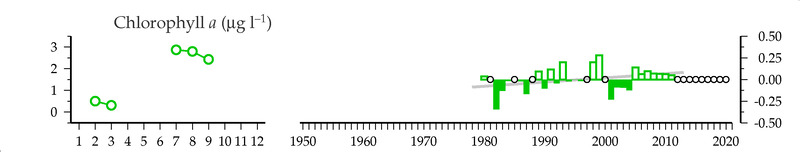
Chlorophyll-a (ug/l)
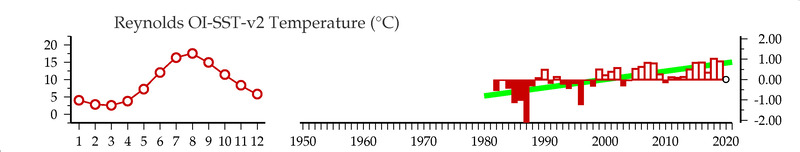
Reynolds OI-SST-v2 Temperature (C)
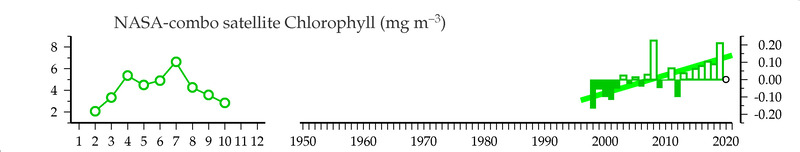
NASA-combo satellite Chlorophyll (mg/m3)
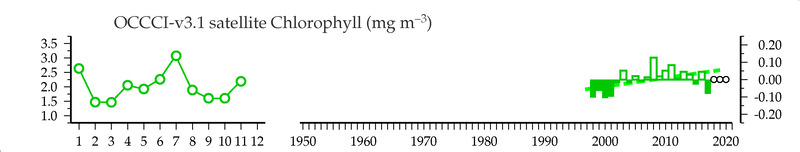
OCCCI-v3.1 satellite Chlorophyll (mg/m3)
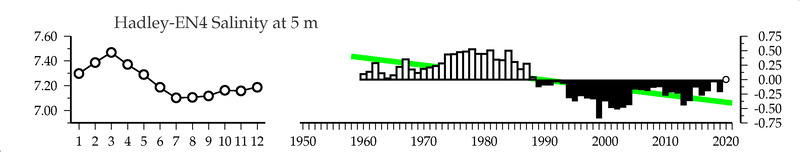
Hadley-EN4 Salinity () at 5 m
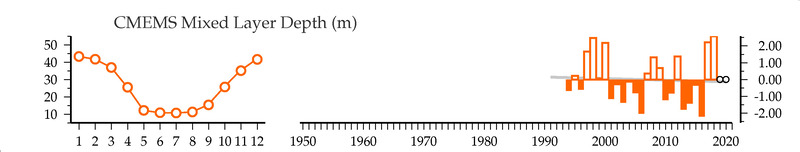
CMEMS Mixed Layer Depth (m)
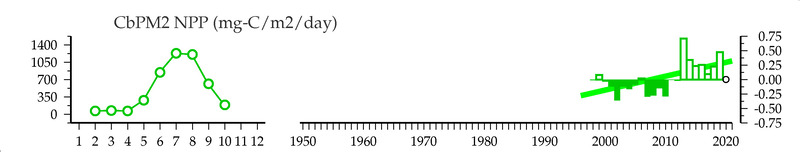
CbPM2 NPP (mg-C/m2/day)
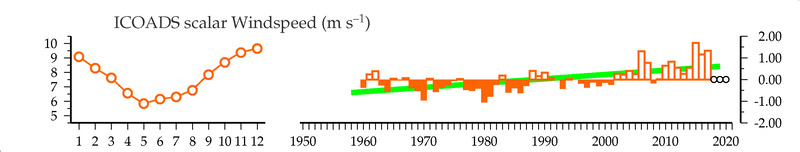
ICOADS scalar Windspeed (m/s)
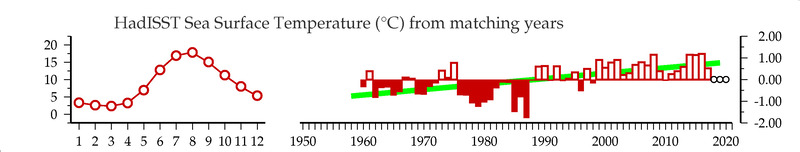
HadISST Sea Surface Temperature (C) from matching years
HadISST Sea Surface Temperature (C) from 1960-present
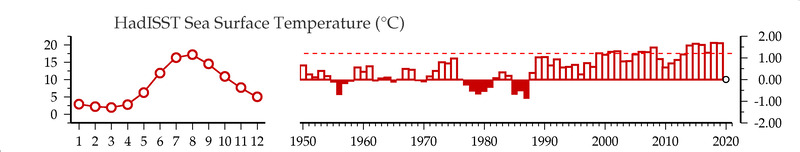
HadISST Sea Surface Temperature (C)
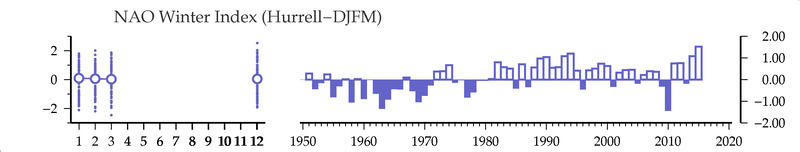
NAO Winter Index
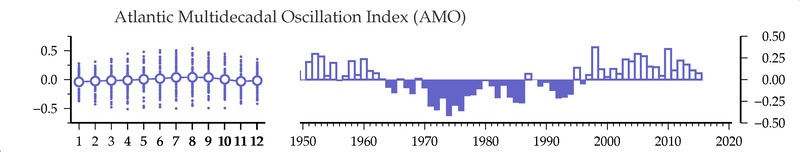
Atlantic Multidecadal Oscillation Index
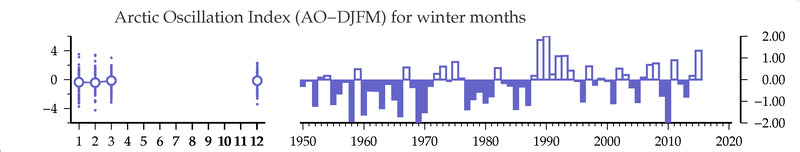
Arctic Oscillation Index (winter months)
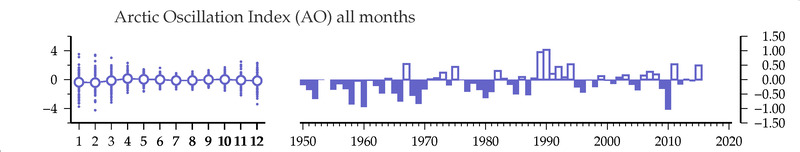
Arctic Oscillation Index
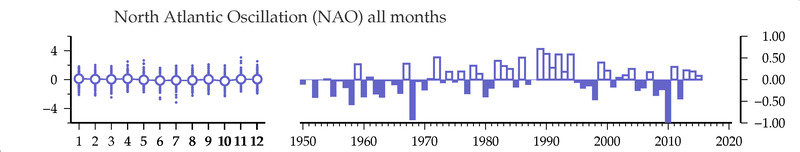
North Atlantic Oscillation