Multi-Variable Comparison & Correlation Plot (MVCCP)
Checked variables will have their figure shown below. Uncheck any variable to remove its plot from below.
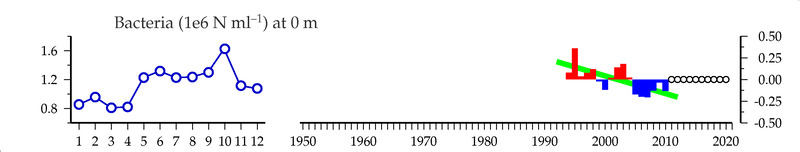
Bacteria (cells x 1E6 / ml) at 0 m
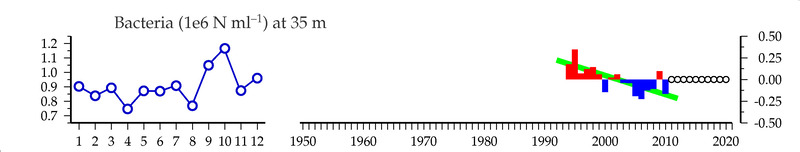
Bacteria (cells x 1E6 / ml) at 35 m
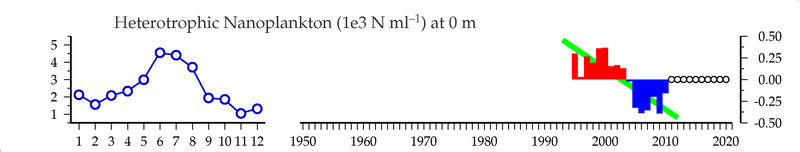
Heterotrophic Nanoplankton (cells x 1E3 / ml) at 0 m
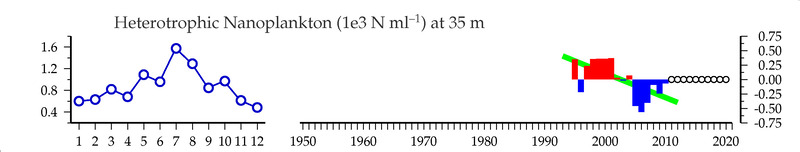
Heterotrophic Nanoplankton (cells x 1E3 / ml) at 35 m
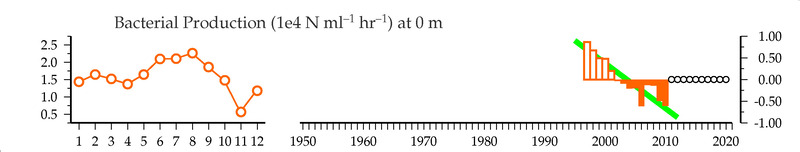
Bacterial Production ( cells x 1E4 / ml / hour ) at 0 m
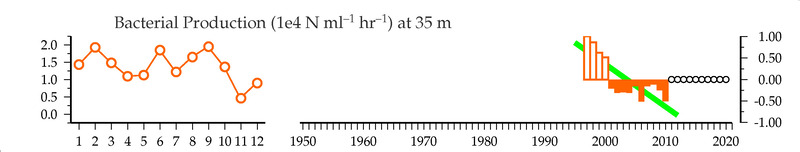
Bacterial Production ( cells x 1E4 / ml / hour ) at 35 m
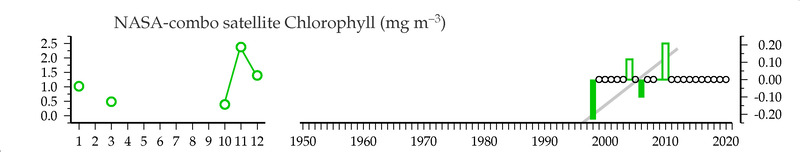
NASA-combo satellite Chlorophyll (mg/m3)
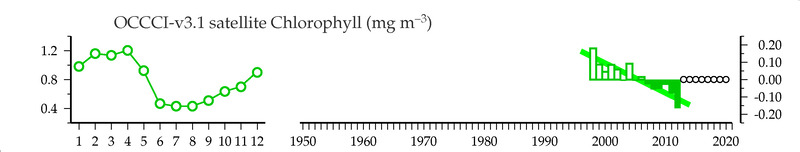
OCCCI-v3.1 satellite Chlorophyll (mg/m3)
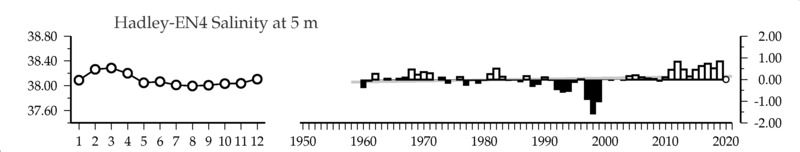
Hadley-EN4 Salinity () at 5 m
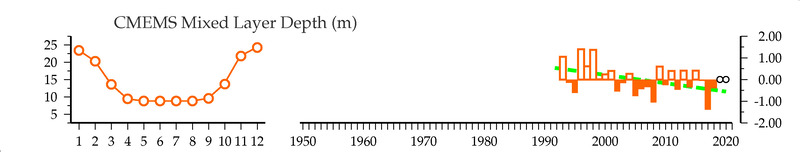
CMEMS Mixed Layer Depth (m)
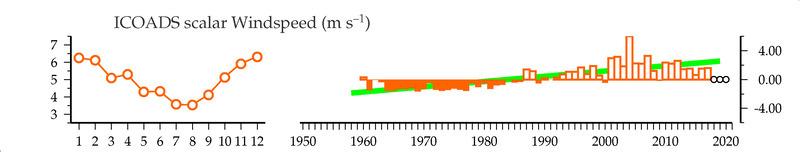
ICOADS scalar Windspeed (m/s)
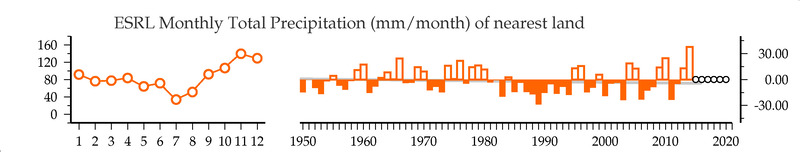
ESRL Monthly Total Precipitation (mm/month) of nearest land
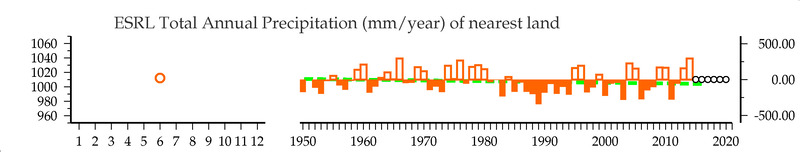
ESRL Total Annual Precipitation (mm/year) of nearest land
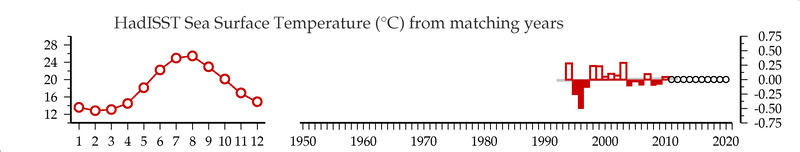
HadISST Sea Surface Temperature (C) from matching years
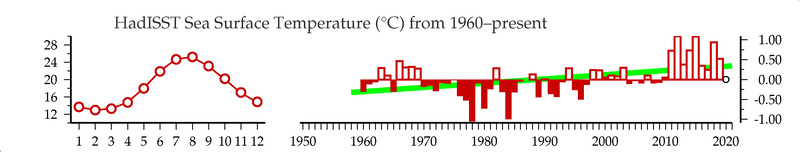
HadISST Sea Surface Temperature (C) from 1960-present
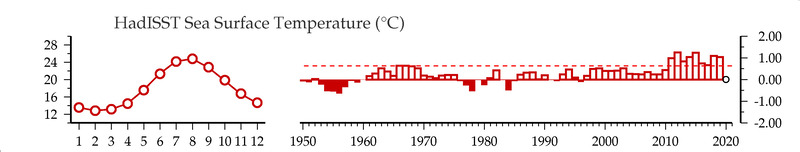
HadISST Sea Surface Temperature (C)
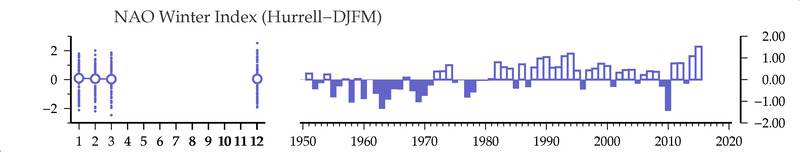
NAO Winter Index
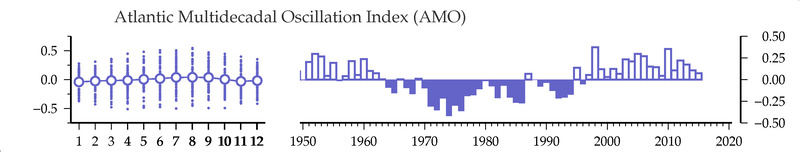
Atlantic Multidecadal Oscillation Index
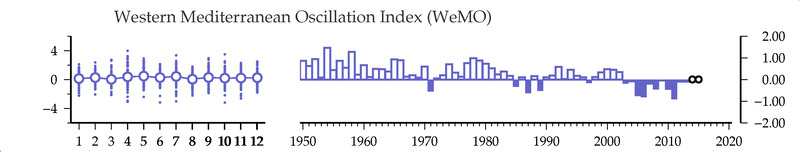
Western Mediterranean Oscillation Oscillation
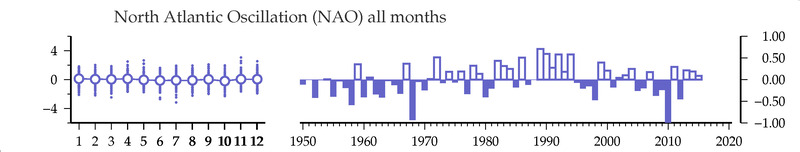
North Atlantic Oscillation