Multi-Variable Comparison & Correlation Plot (MVCCP)
Checked variables will have their figure shown below. Uncheck any variable to remove its plot from below.
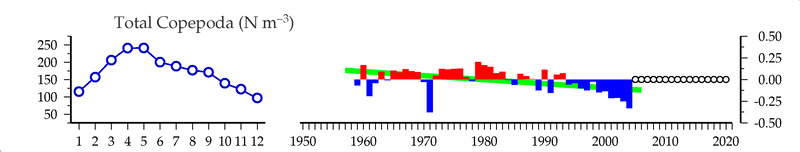
Total Copepoda (#/m3)
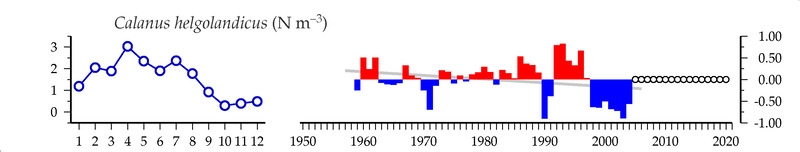
Calanus helgolandicus (#/m3)
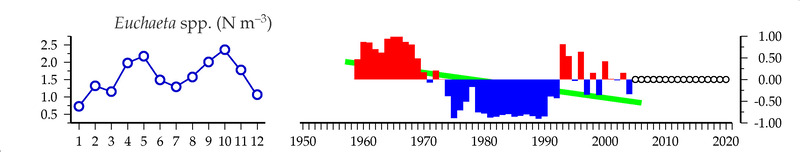
Euchaeta spp. (#/m3)
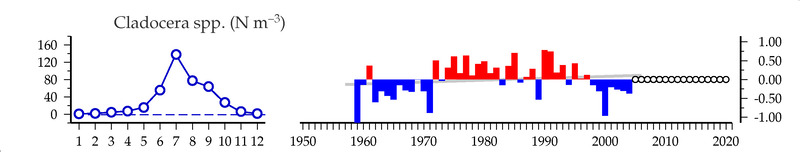
Cladocera spp. (#/m3)
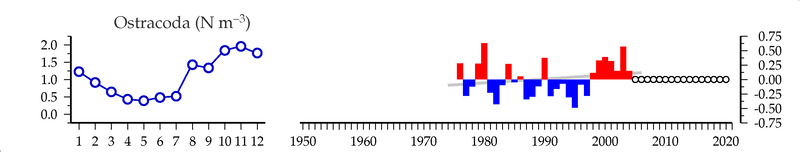
Ostracoda (#/m3)
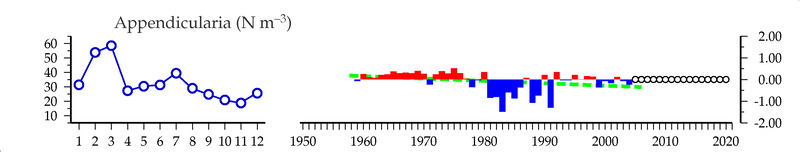
Appendicularia (#/m3)
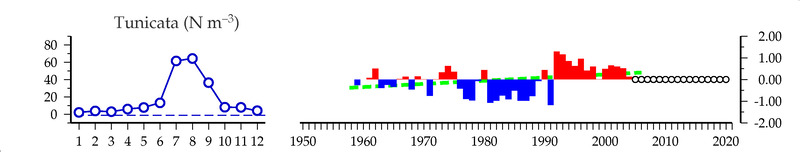
Tunicata (#/m3)
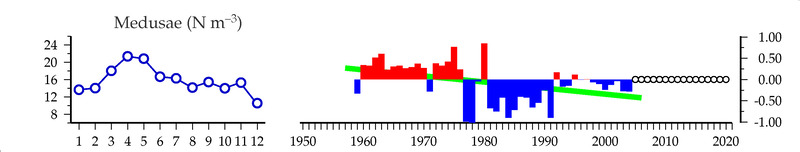
Medusae (#/m3)
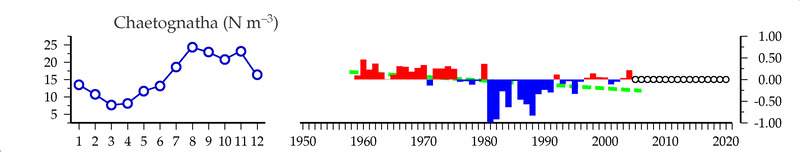
Chaetognatha (#/m3)
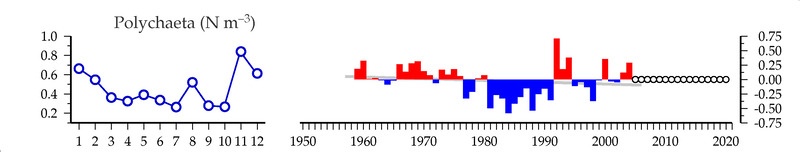
Polychaeta (#/m3)
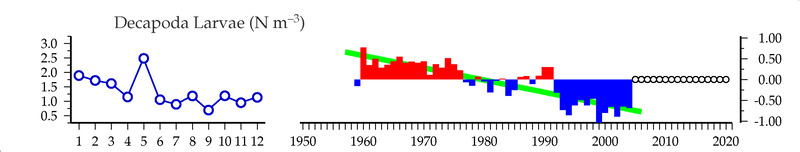
Decapoda Larvae (#/m3)
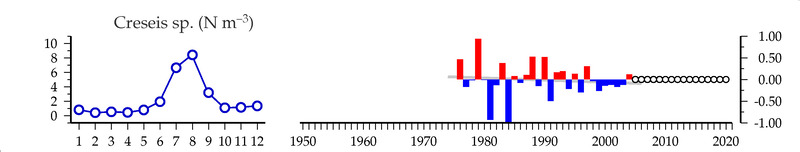
Creseis sp. (#/m3)
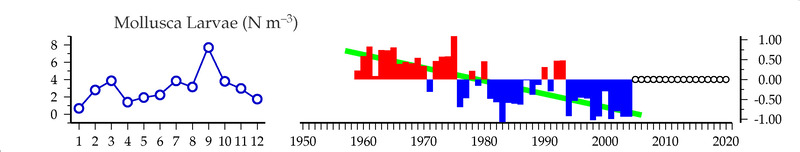
Mollusca Larvae (#/m3)
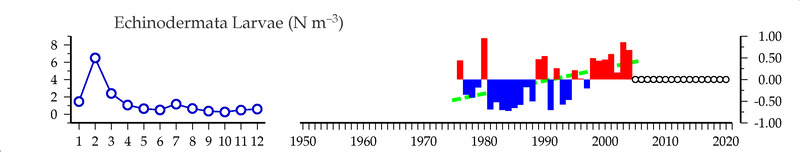
Echinodermata Larvae (#/m3)
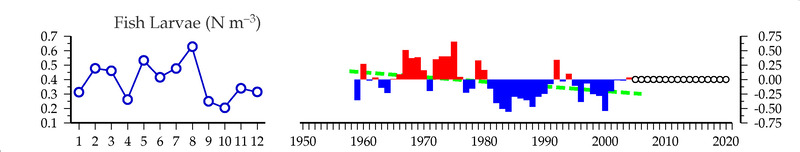
Fish Larvae (#/m3)
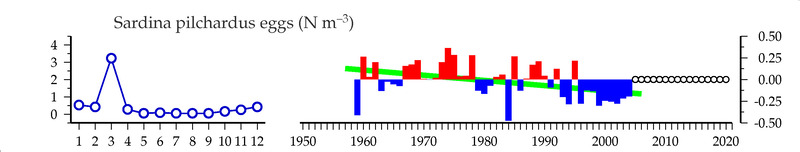
Sardina pilchardus eggs (#/m3)
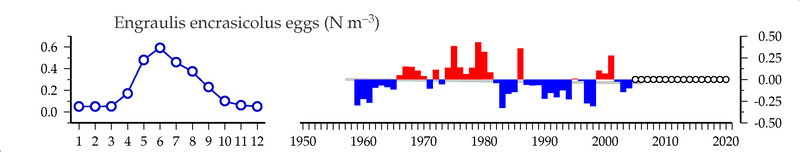
Engraulis encrasicolus eggs (#/m3)
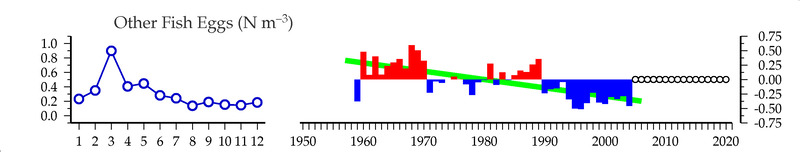
Other Fish Eggs (#/m3)
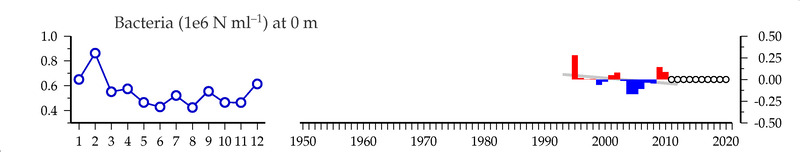
Bacteria (cells x 1E6 / ml) at 0 m
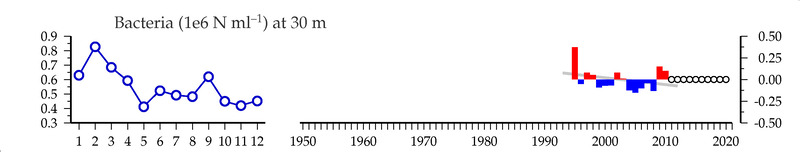
Bacteria (cells x 1E6 / ml) at 30 m
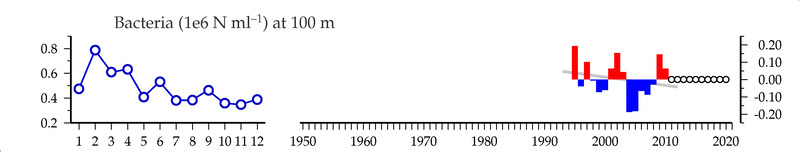
Bacteria (cells x 1E6 / ml) at 100 m
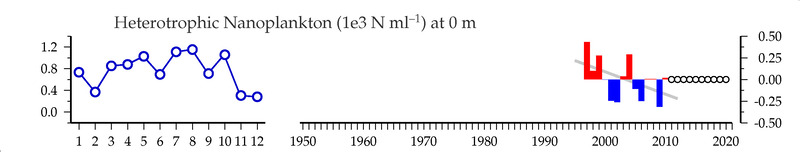
Heterotrophic Nanoplankton (cells x 1E3 / ml) at 0 m
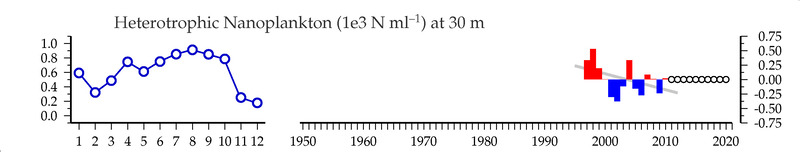
Heterotrophic Nanoplankton (cells x 1E3 / ml) at 30 m
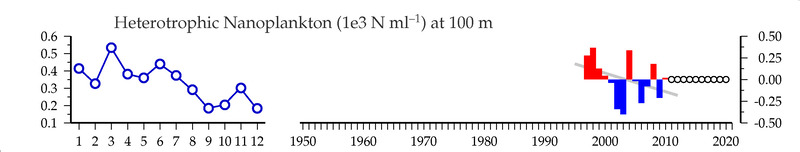
Heterotrophic Nanoplankton (cells x 1E3 / ml) at 100 m
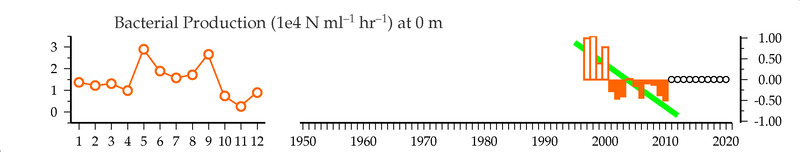
Bacterial Production ( cells x 1E4 / ml / hour ) at 0 m
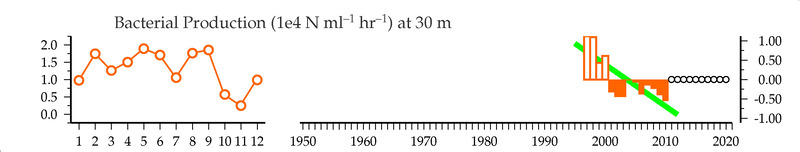
Bacterial Production ( cells x 1E4 / ml / hour ) at 30 m
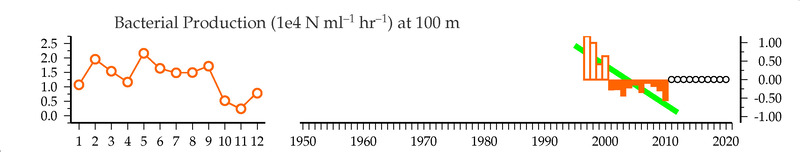
Bacterial Production ( cells x 1E4 / ml / hour ) at 100 m
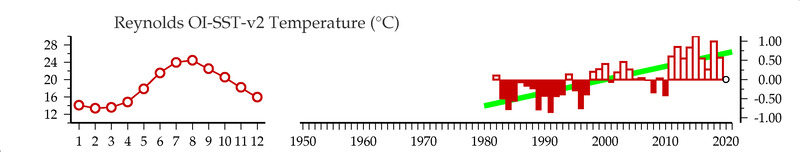
Reynolds OI-SST-v2 Temperature (C)
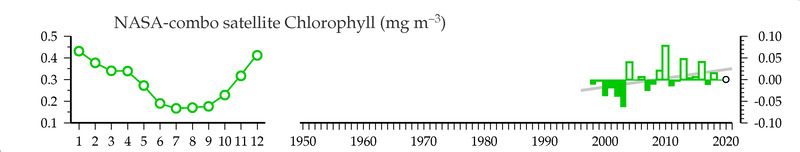
NASA-combo satellite Chlorophyll (mg/m3)
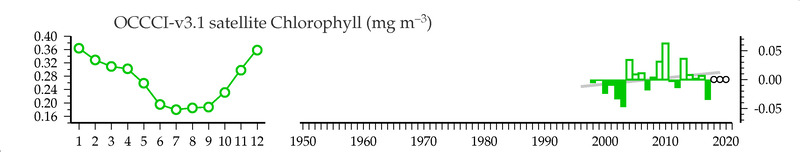
OCCCI-v3.1 satellite Chlorophyll (mg/m3)
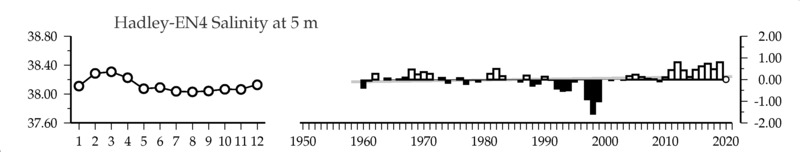
Hadley-EN4 Salinity () at 5 m
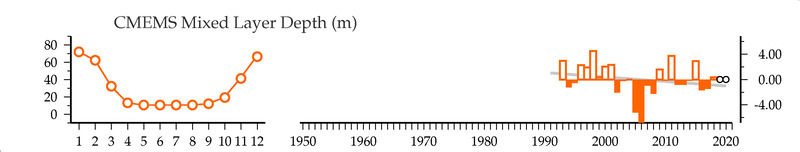
CMEMS Mixed Layer Depth (m)
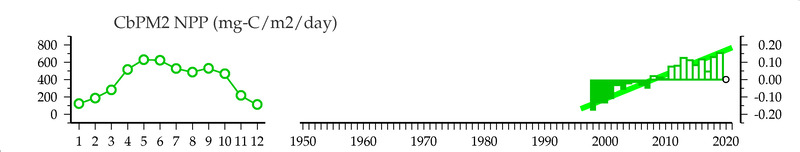
CbPM2 NPP (mg-C/m2/day)
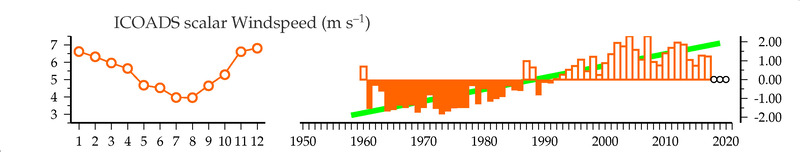
ICOADS scalar Windspeed (m/s)
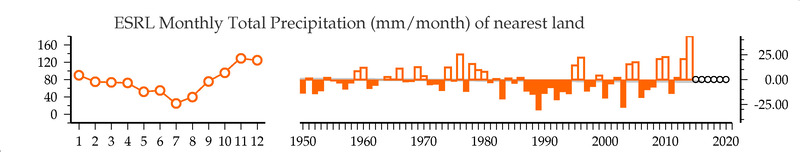
ESRL Monthly Total Precipitation (mm/month) of nearest land
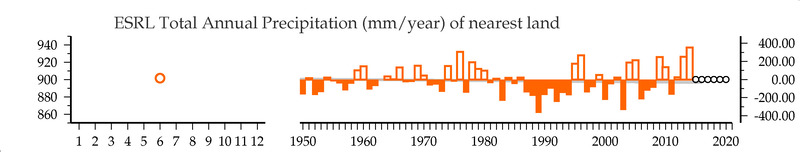
ESRL Total Annual Precipitation (mm/year) of nearest land
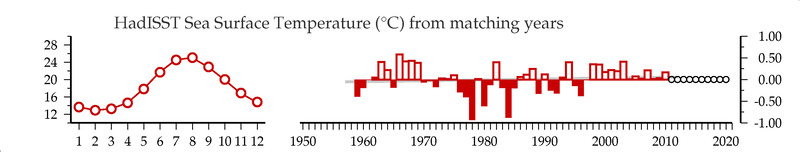
HadISST Sea Surface Temperature (C) from matching years
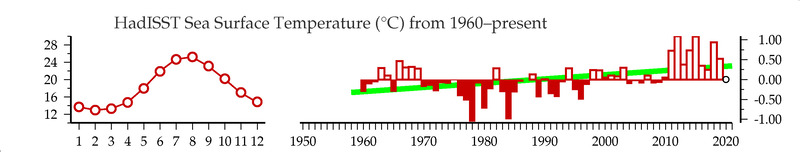
HadISST Sea Surface Temperature (C) from 1960-present
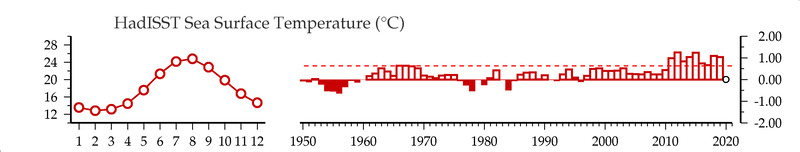
HadISST Sea Surface Temperature (C)
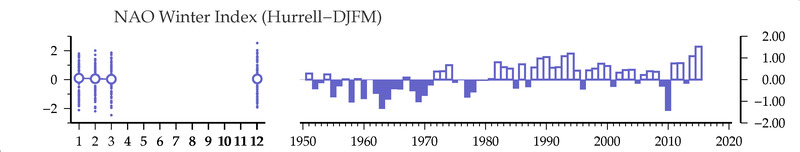
NAO Winter Index
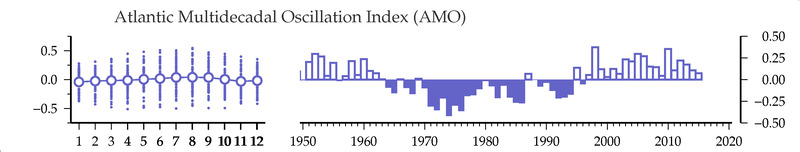
Atlantic Multidecadal Oscillation Index
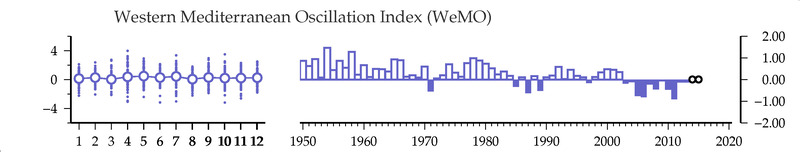
Western Mediterranean Oscillation Oscillation
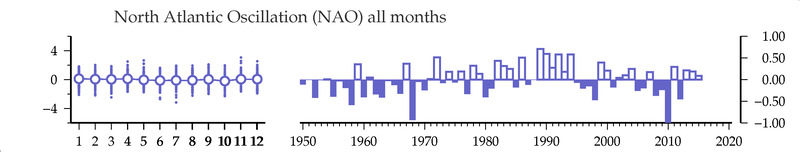
North Atlantic Oscillation