Multi-Variable Comparison & Correlation Plot (MVCCP)
Checked variables will have their figure shown below. Uncheck any variable to remove its plot from below.
Total Copepods (#/m2)
Acartia spp. (#/m2)
Eurytemora spp. (#/m2)
Pseudocalanus spp. (#/m2)
Limnocalanus macrurus (#/m2)
Bosmina/Eubosmina spp. (#/m2)
Podon spp. (#/m2)
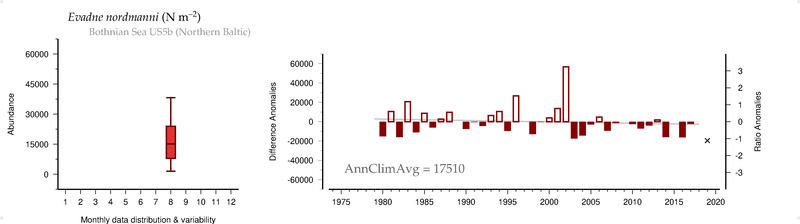
Evadne nordmanni (#/m2)
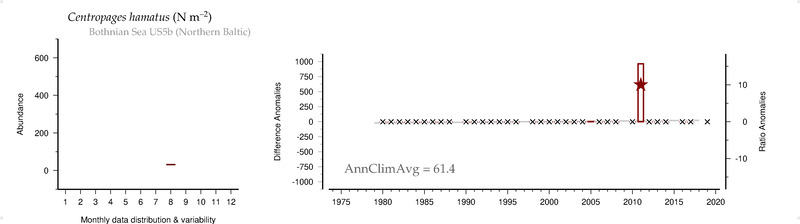
Centropages hamatus (#/m2)
Temora longicornis (#/m2)
Total Diatomophyceae (#/L)
Total Diatomophyceae biomass (ug/L)
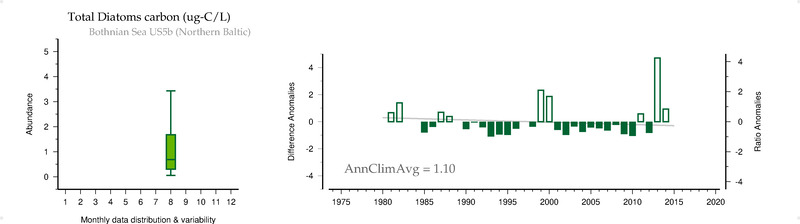
Total Diatomophyceae carbon (ug-C/L)
Total Dinophyceae (#/L)
Total Dinophyceae biomass (ug/L)
Total Dinophyceae carbon (ug-C/L)
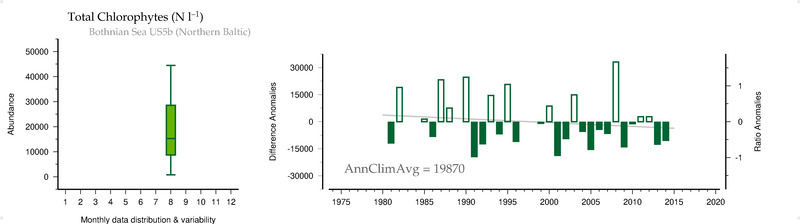
Total Chlorophyceae (#/L)
Total Chlorophyceae biomass (ug/L)
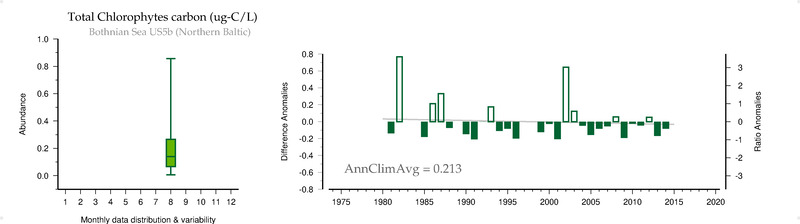
Total Chlorophyceae carbon (ug-C/L)
Total Cryptophyceae (#/L)
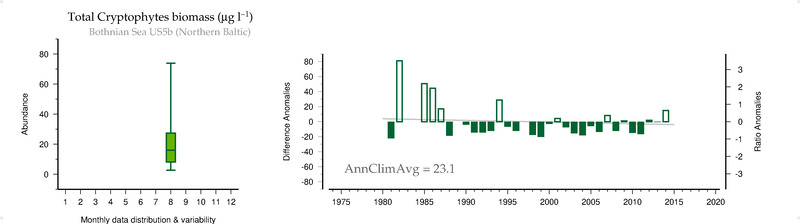
Total Cryptophyceae biomass (ug/L)
Total Cryptophyceae carbon (ug-C/L)
Total Euglenophyceae (#/L)
Total Euglenophyceae biomass (ug/L)
Total Euglenophyceae carbon (ug-C/L)
Total Charophyceae (#/L)
Total Charophyceae biomass (ug/L)
Total Charophyceae carbon (ug-C/L)
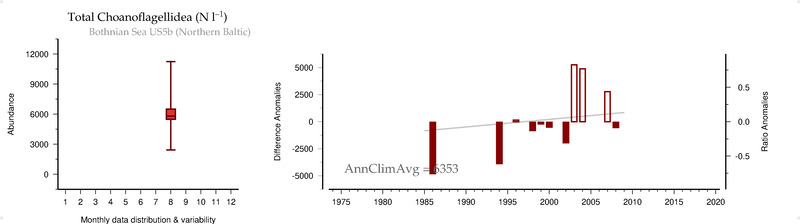
Total Choanoflagellidea (#/L)
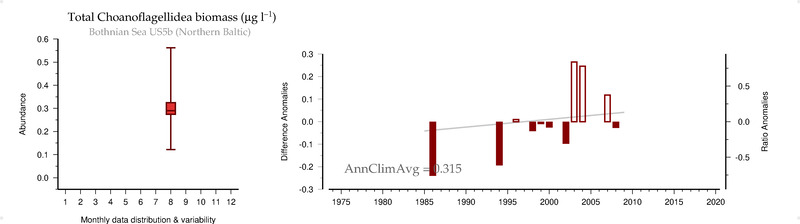
Total Choanoflagellidea biomass (ug/L)
Total Choanoflagellidea carbon (ug-C/L)
Total Ciliates (#/L)
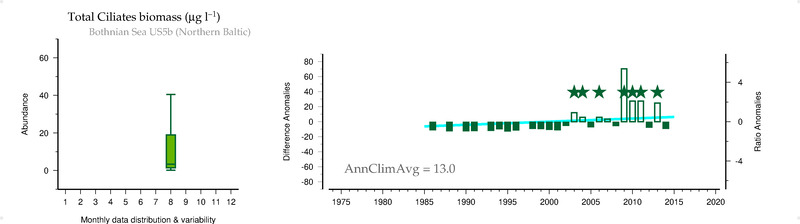
Total Ciliates biomass (ug/L)
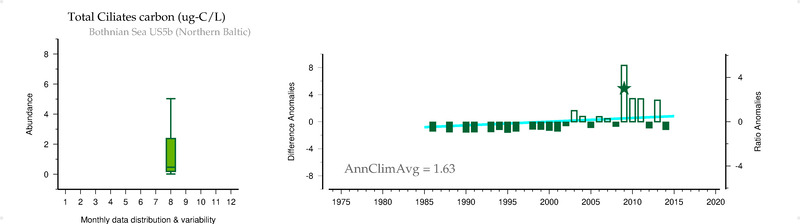
Total Ciliates carbon (ug-C/L)
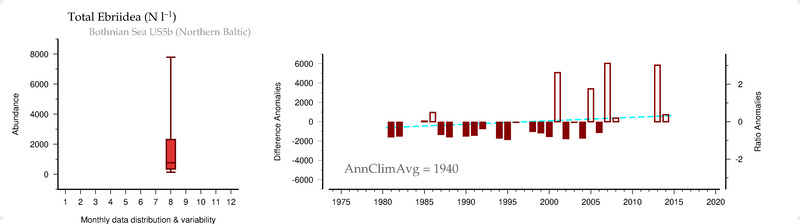
Total Ebriidea (#/L)
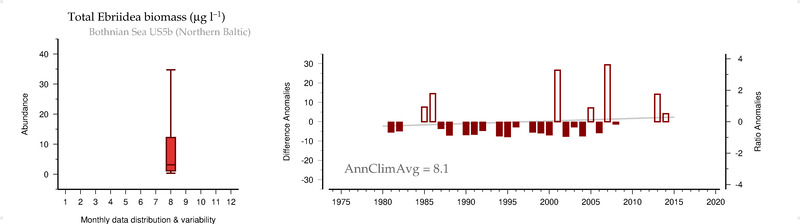
Total Ebriidea biomass (ug/L)
Total Ebriidea carbon (ug-C/L)
Total Nostocophyceae (#/L)
Total Nostocophyceae biomass (ug/L)
Total Nostocophyceae carbon (ug-C/L)
Total Prasinophyceae (#/L)
Total Prasinophyceae biomass (ug/L)
Total Prasinophyceae carbon (ug-C/L)
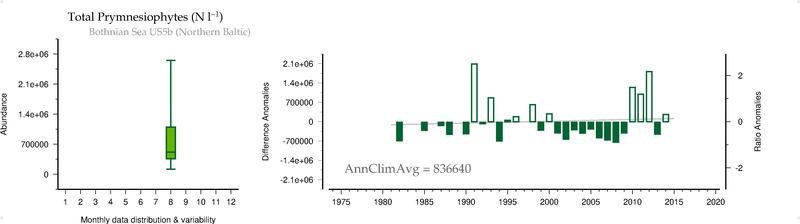
Total Prymnesiophyceae (#/L)
Total Prymnesiophyceae biomass (ug/L)
Total Prymnesiophyceae carbon (ug-C/L)
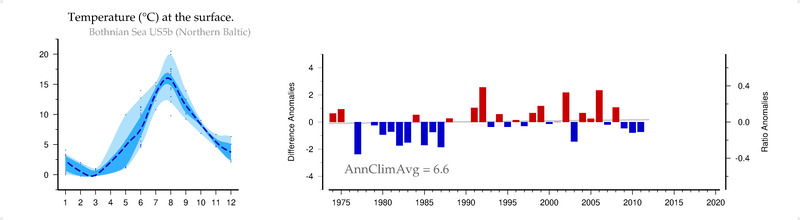
Temperature ( C ) at the surface.
Salinity () at the surface.
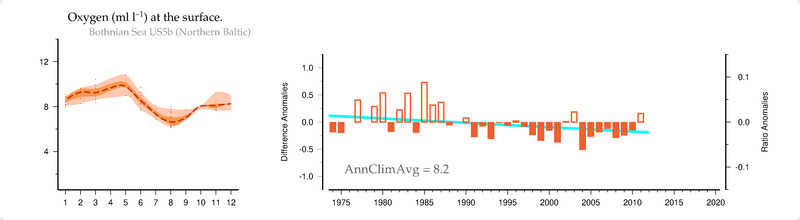
Oxygen (ml/l) at the surface.
Oxygen Saturation (%) at the surface.
Phosphate (um) at the surface.
Silicate (um) at the surface.
Nitrite (um) at the surface.
NO3NO2 (um) at the surface.
Ammonium (um) at the surface.
Total Phosphate (um) at the surface.
Total Nitrogen (um) at the surface.
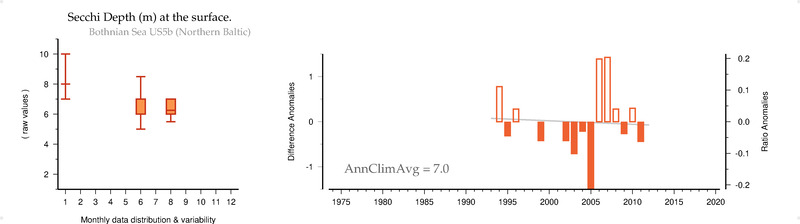
Secchi Depth (m) at the surface.
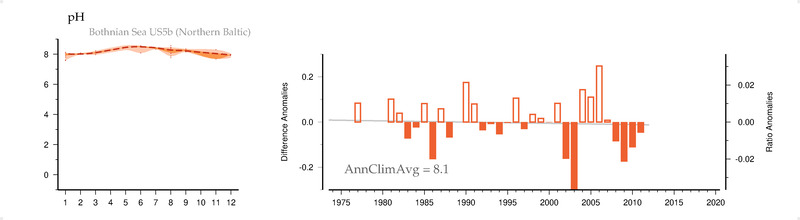
pH
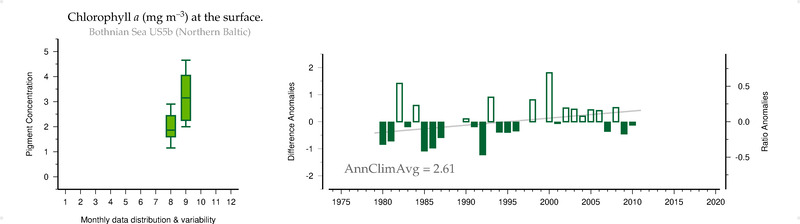
Chlorophyll-a (mg/m3) at the surface.
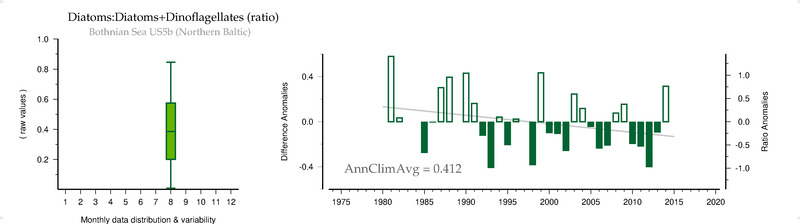
Diatoms:Diatoms+Dinoflagellates (ratio)
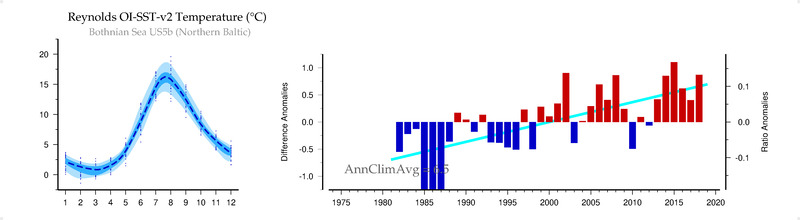
Reynolds OI-SST-v2 Temperature (C)
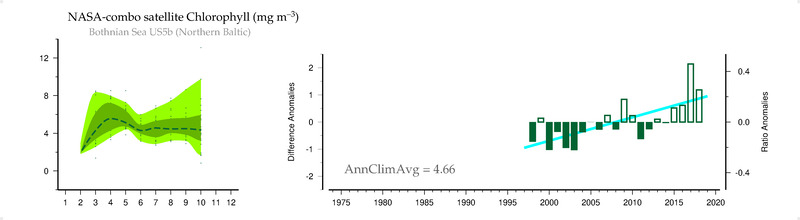
NASA-combo satellite Chlorophyll (mg/m3)
OCCCI-v5.0 satellite Chlorophyll (mg/m3)
Hadley-EN4 Salinity () at 5 m
CMEMS Mixed Layer Depth (m)
CbPM2 NPP (mg-C/m2/day)
ICOADS scalar Windspeed (m/s)
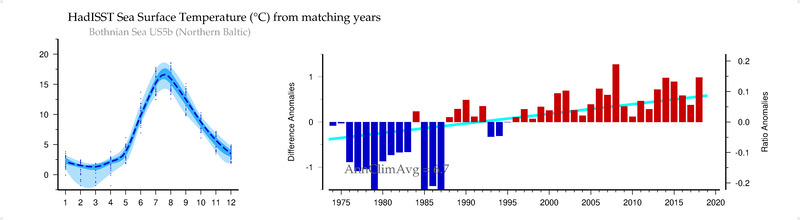
HadISST Sea Surface Temperature (C) from matching years
HadISST Sea Surface Temperature (C) from 1960-present
HadISST Sea Surface Temperature (C)