Multi-Variable Comparison & Correlation Plot (MVCCP)
Checked variables will have their figure shown below. Uncheck any variable to remove its plot from below.
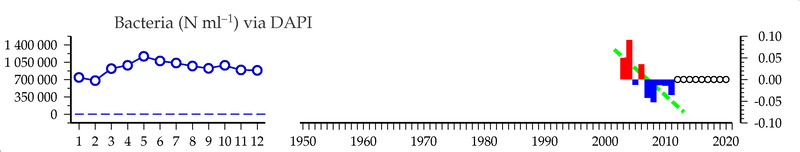
Bacteria (#/ml) via DAPI
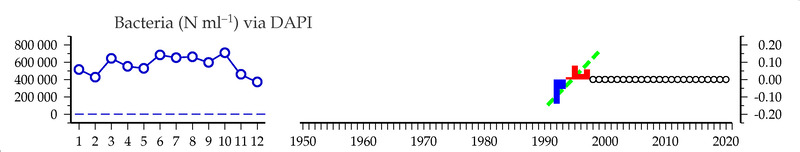
Bacteria (#/ml) via DAPI
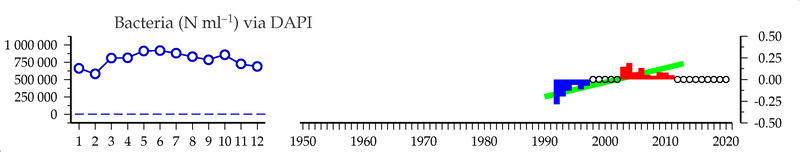
Bacteria (#/ml) via DAPI
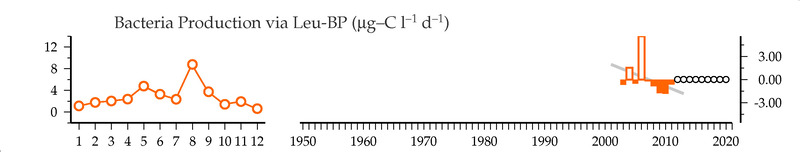
Bacteria Production via Leu-BP (ugC/l/d)
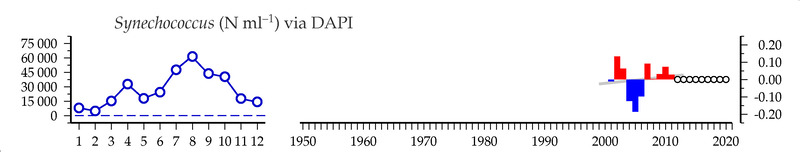
Synechococcus (#/ml) via DAPI
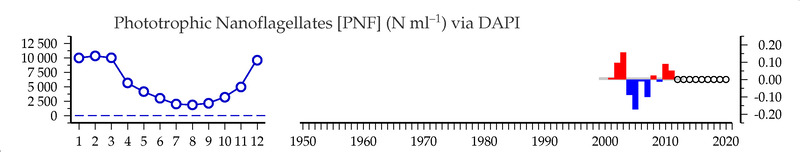
Phototrophic Nanoflagellates [PNF] (#/ml) via DAPI
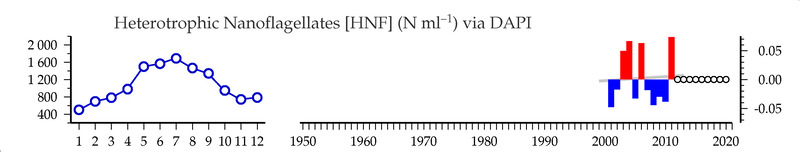
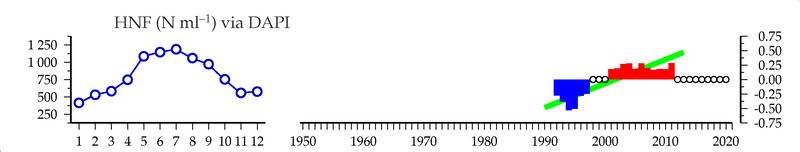
Heterotrophic Nanoflagellates [HNF] (#/ml) via DAPI
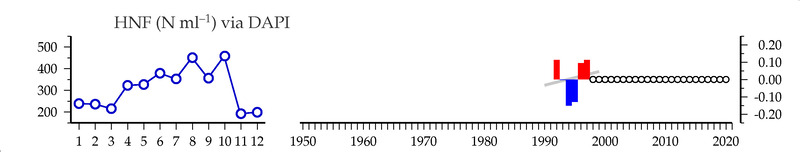
HNF (#/ml) via DAPI
HNF (#/ml) via DAPI
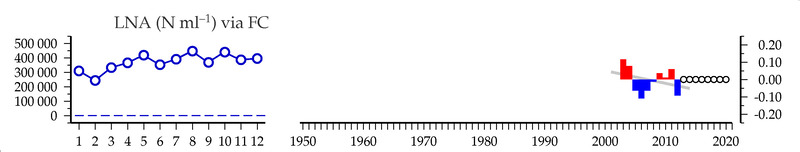
LNA (#/ml) via FC
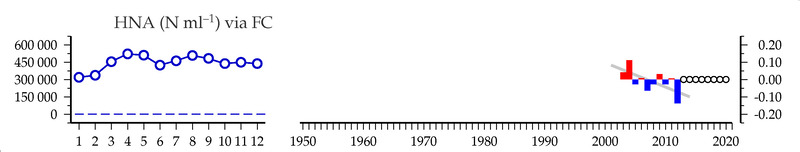
HNA (#/ml) via FC
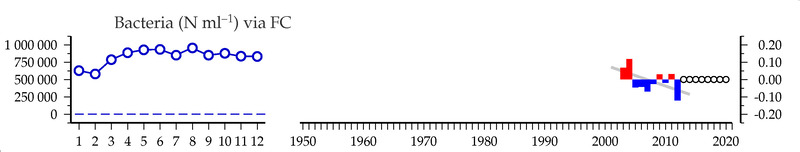
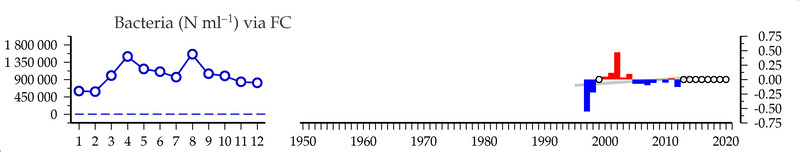
Bacteria (#/ml) via FC
Bacteria (#/ml) via FC
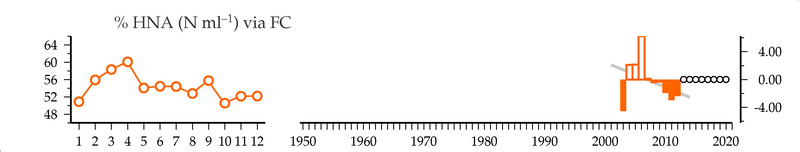
% HNA (#/ml) via FC
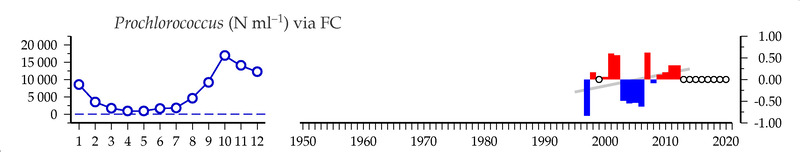
Prochlorococcus (#/ml) via FC
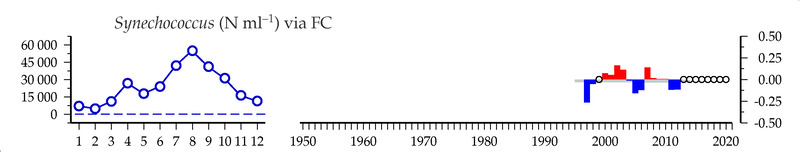
Synechococcus (#/ml) via FC
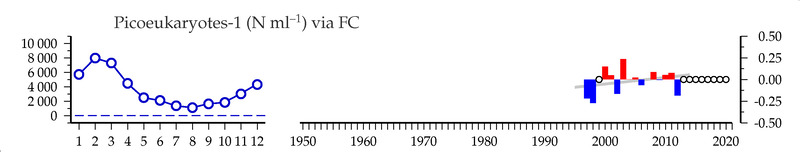
Picoeukaryotes-1 (#/ml) via FC
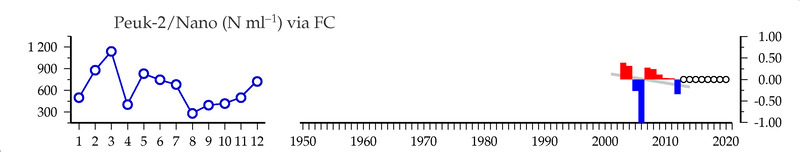
Peuk-2/Nano (#/ml) via FC
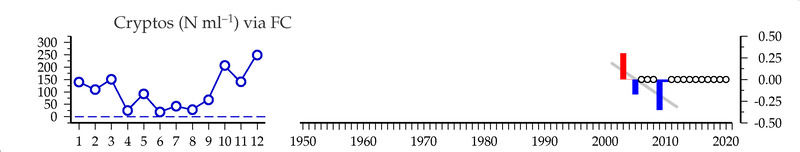
Cryptos (#/ml) via FC
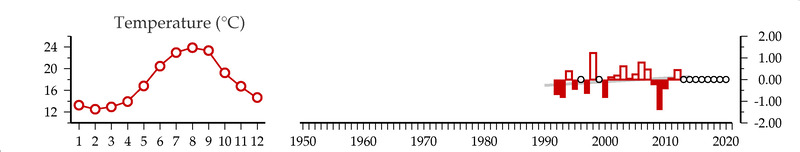
Temperature ( C )
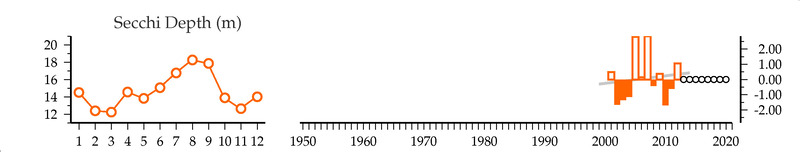
Secchi Depth (m)
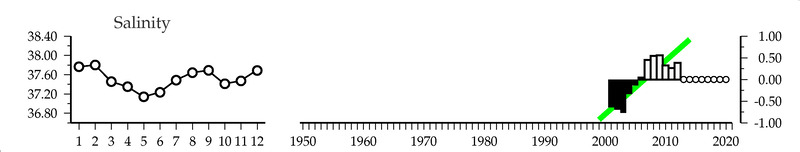
Salinity ()
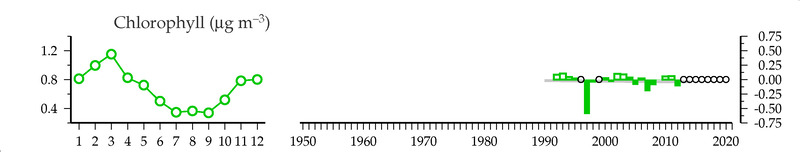
Chlorophyll (ug/m3)
PO4 (um)
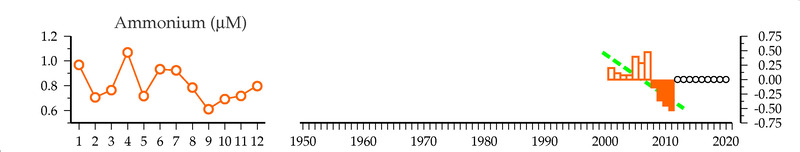
NH4 (um)
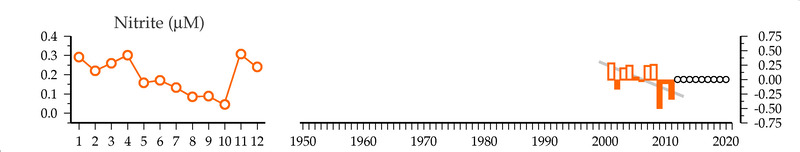
NO2 (um)
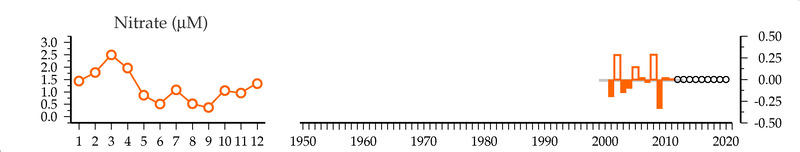
NO3 (um)
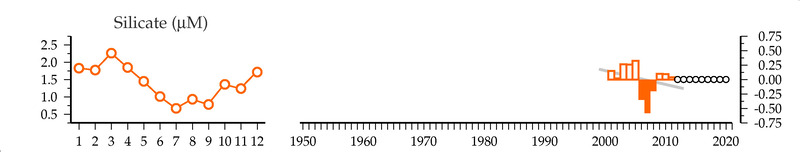
Silicate (um)
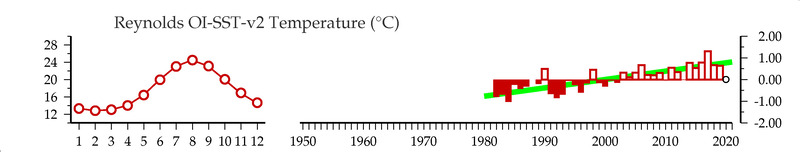
Reynolds OI-SST-v2 Temperature (C)
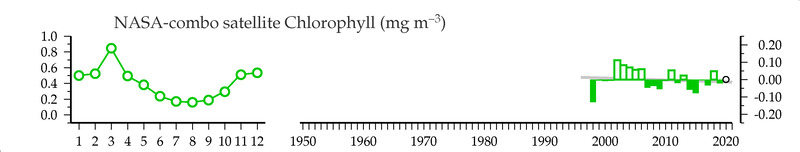
NASA-combo satellite Chlorophyll (mg/m3)
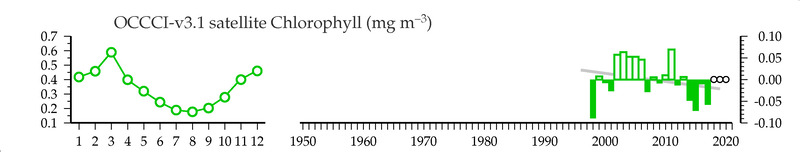
OCCCI-v3.1 satellite Chlorophyll (mg/m3)
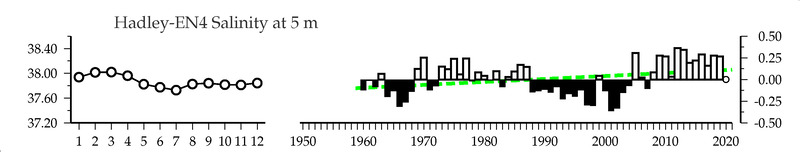
Hadley-EN4 Salinity () at 5 m
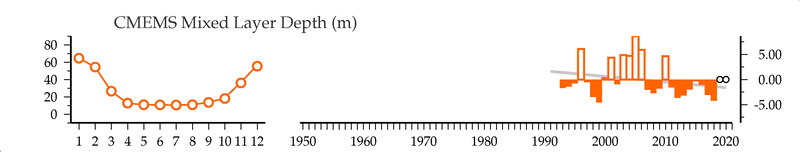
CMEMS Mixed Layer Depth (m)
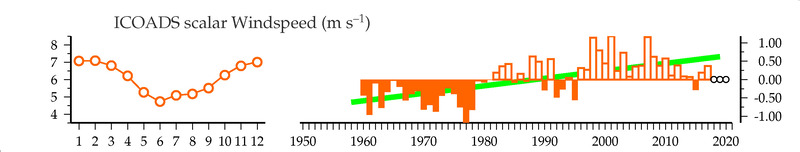
ICOADS scalar Windspeed (m/s)
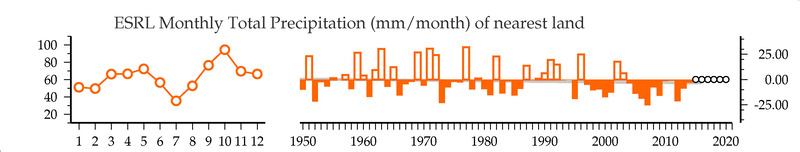
ESRL Monthly Total Precipitation (mm/month) of nearest land
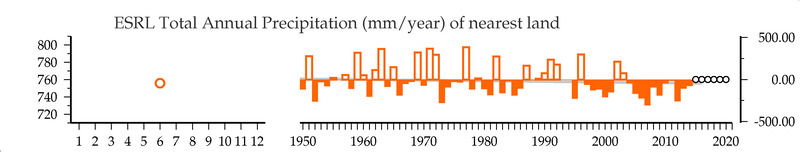
ESRL Total Annual Precipitation (mm/year) of nearest land
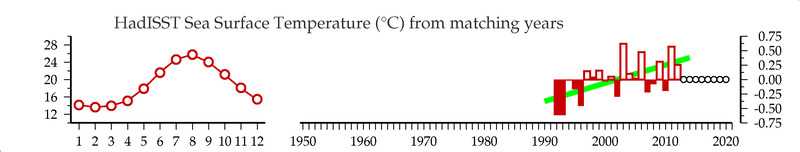
HadISST Sea Surface Temperature (C) from matching years
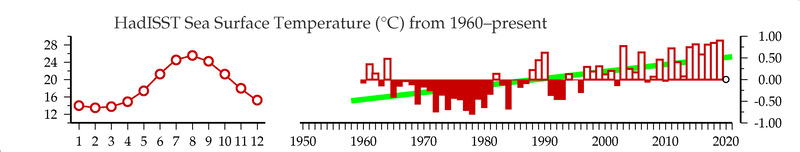
HadISST Sea Surface Temperature (C) from 1960-present
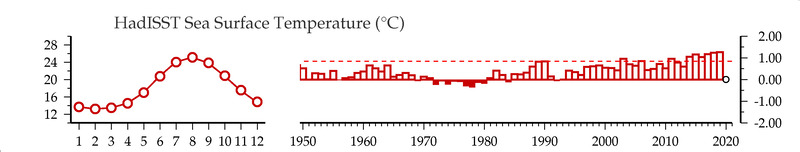
HadISST Sea Surface Temperature (C)
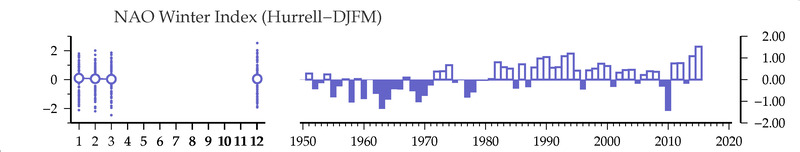
NAO Winter Index
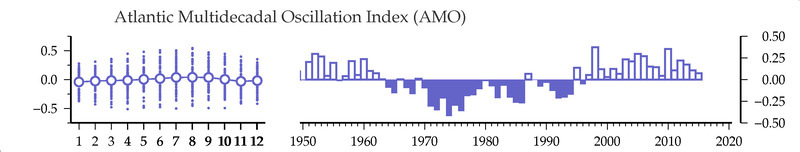
Atlantic Multidecadal Oscillation Index
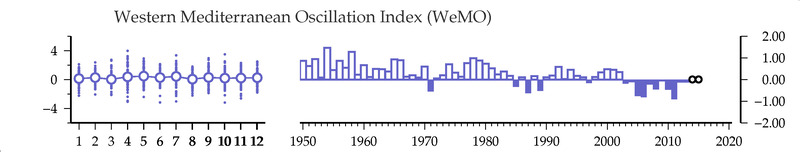
Western Mediterranean Oscillation Oscillation
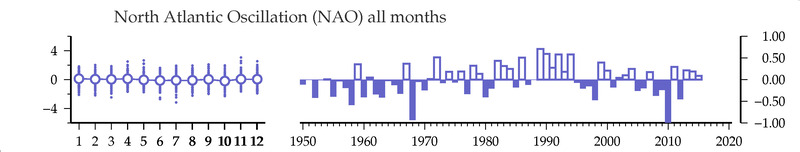
North Atlantic Oscillation