Multi-Variable Comparison & Correlation Plot (MVCCP)
Checked variables will have their figure shown below. Uncheck any variable to remove its plot from below.
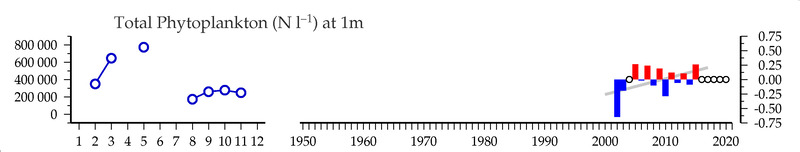
Total Phytoplankton (cells/l) at 1m
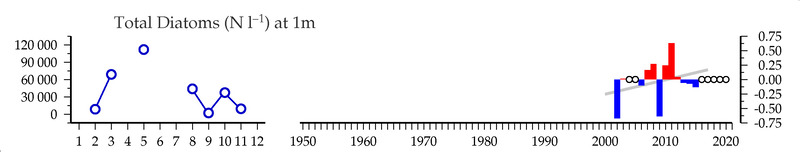
Total Diatoms (cells/l) at 1m
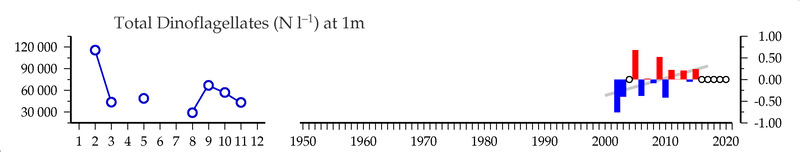
Total Dinoflagellates (cells/l) at 1m
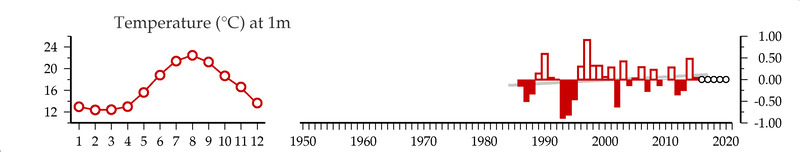
Temperature ( C ) at 1m
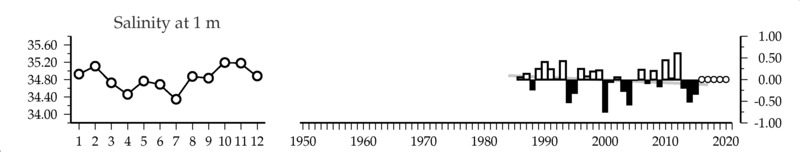
Salinity () at 1 m
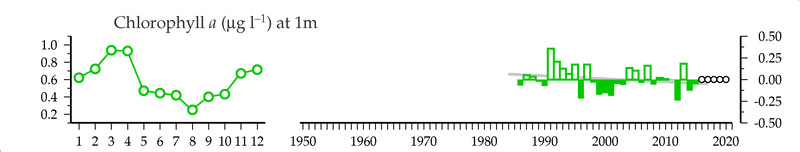
Chlorophyll-a (ug/l) at 1m
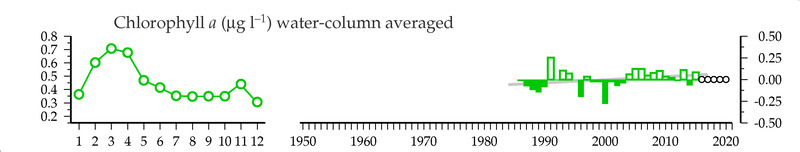
Chlorophyll-a (ug/l) water-column averaged
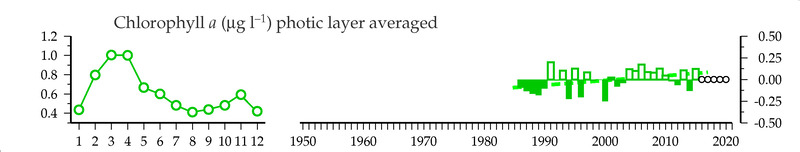
Chlorophyll-a (ug/l) photic layer averaged
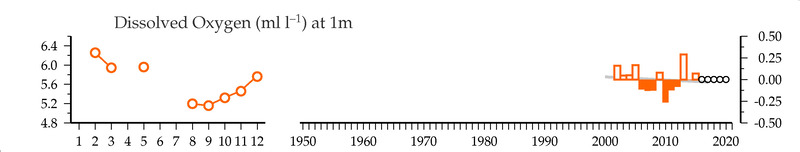
Dissolved Oxygen (ml/l) at 1m
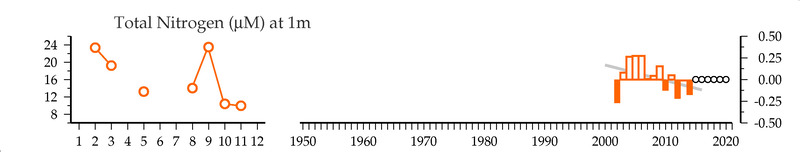
Total Nitrogen (uM) at 1m
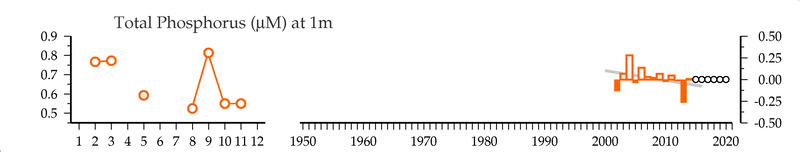
Total Phosphorus (uM) at 1m
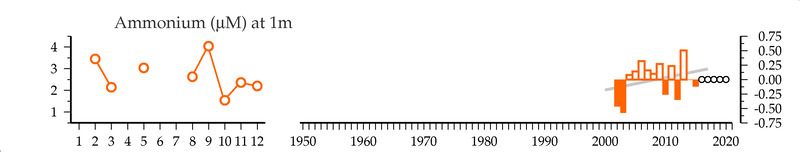
NH4 (uM) at 1m
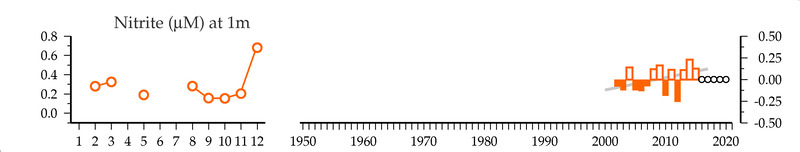
Nitrite (uM) at 1m
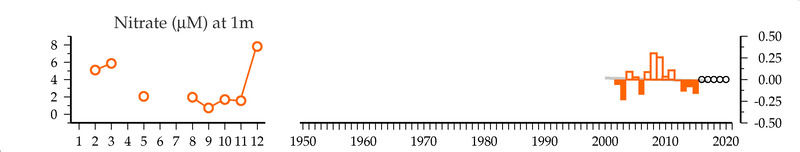
Nitrate (uM) at 1m
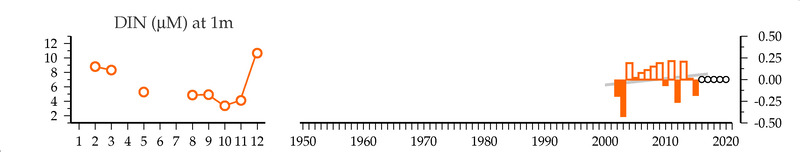
DIN (uM) at 1m
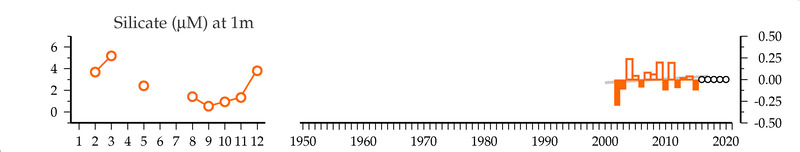
Silicate (uM) at 1m
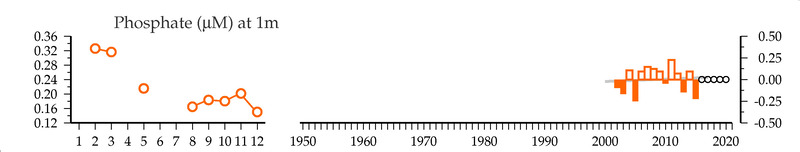
Phosphate (uM) at 1m
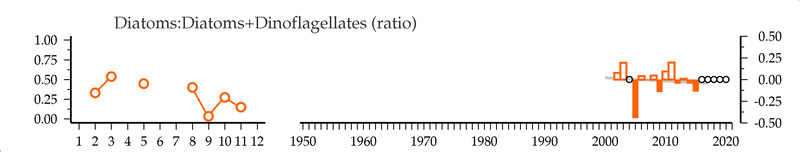
Diatoms:Diatoms+Dinoflagellates (ratio)
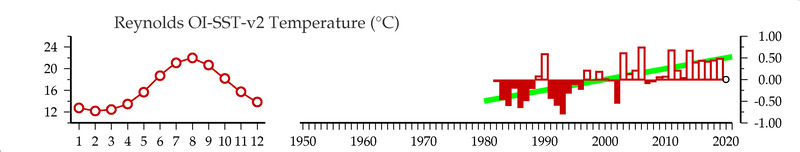
Reynolds OI-SST-v2 Temperature (C)
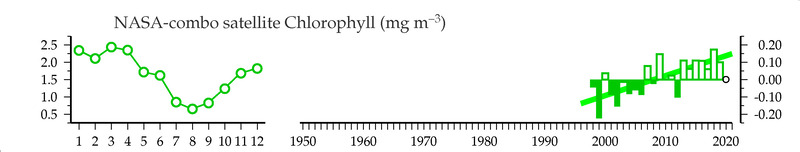
NASA-combo satellite Chlorophyll (mg/m3)
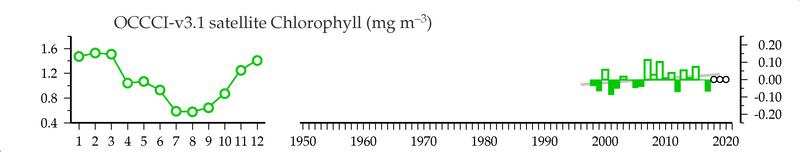
OCCCI-v3.1 satellite Chlorophyll (mg/m3)
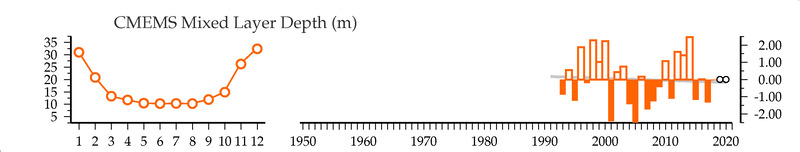
CMEMS Mixed Layer Depth (m)
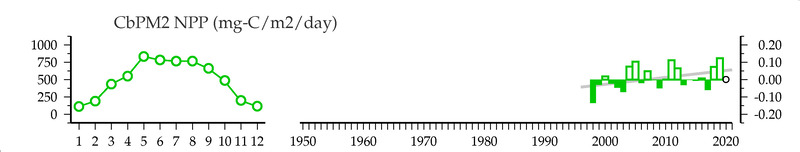
CbPM2 NPP (mg-C/m2/day)
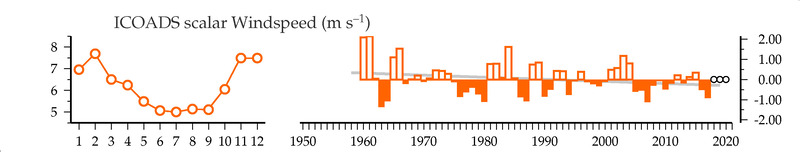
ICOADS scalar Windspeed (m/s)
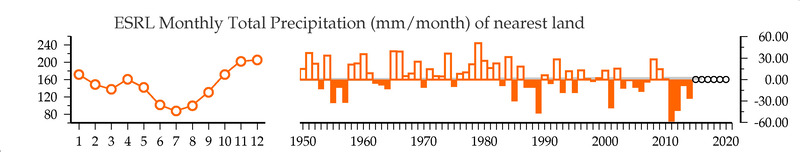
ESRL Monthly Total Precipitation (mm/month) of nearest land
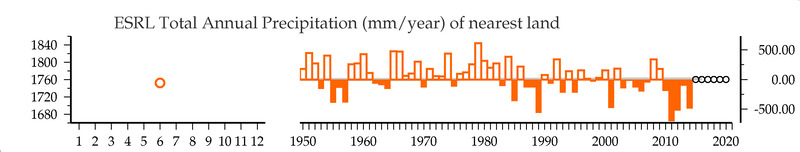
ESRL Total Annual Precipitation (mm/year) of nearest land
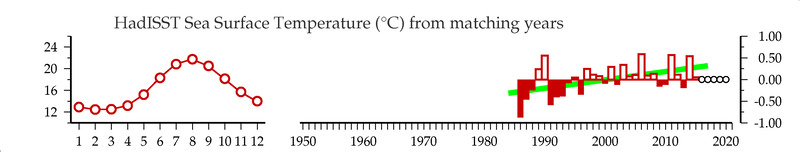
HadISST Sea Surface Temperature (C) from matching years
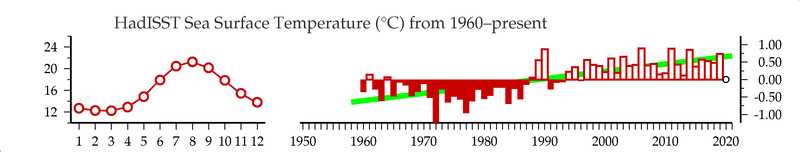
HadISST Sea Surface Temperature (C) from 1960-present
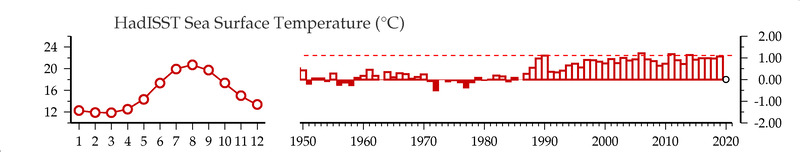
HadISST Sea Surface Temperature (C)
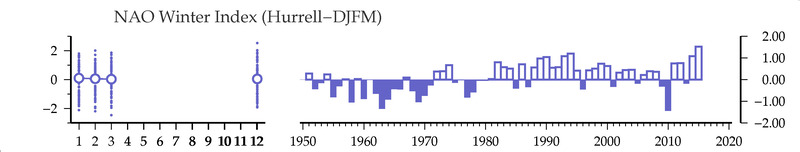
NAO Winter Index
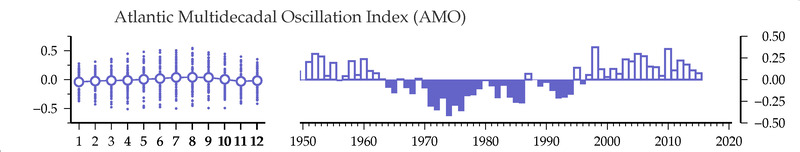
Atlantic Multidecadal Oscillation Index
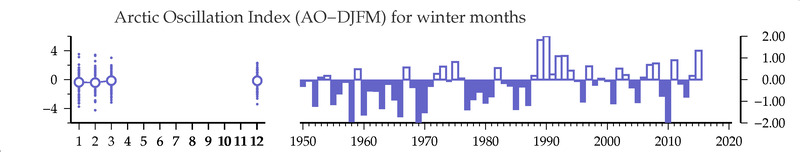
Arctic Oscillation Index (winter months)
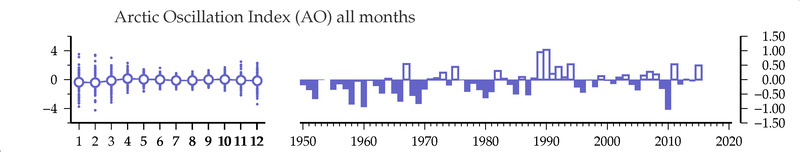
Arctic Oscillation Index
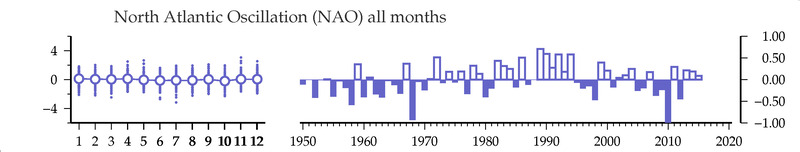
North Atlantic Oscillation