Multi-Variable Comparison & Correlation Plot (MVCCP)
Checked variables will have their figure shown below. Uncheck any variable to remove its plot from below.
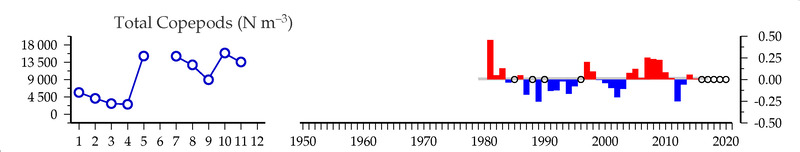
Total Copepods (#/m3)
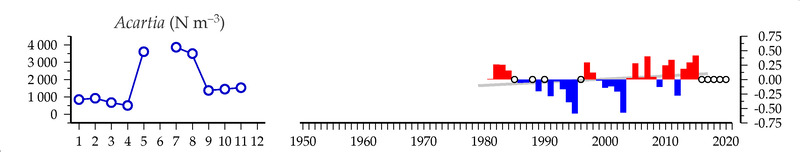
Acartia (#/m3)
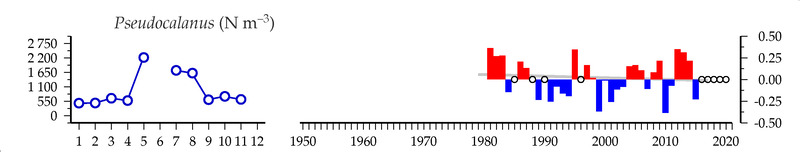
Pseudocalanus (#/m3)
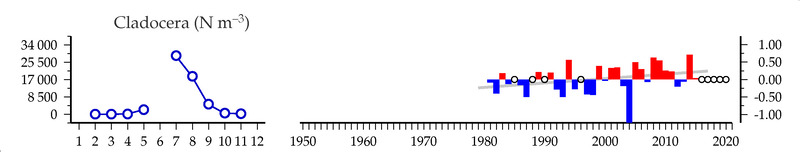
Cladocera (#/m3)
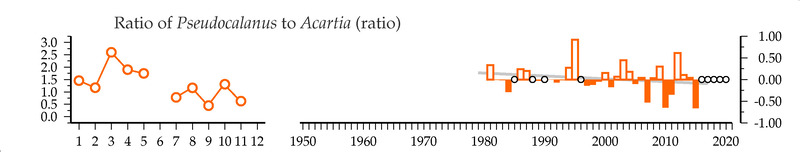
Ratio of Pseudocalanus to Acartia (ratio)
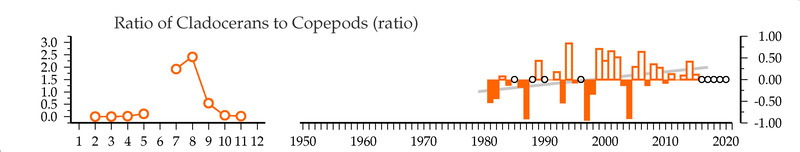
Ratio of Cladocerans to Copepods (ratio)
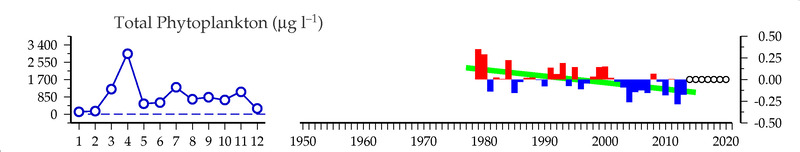
Total Phytoplankton (ug/l)
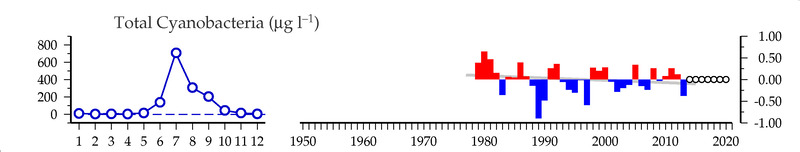
Total Cyanobacteria (ug/l)
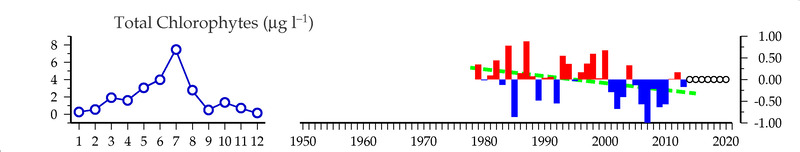
Total Chlorophyceae (ug/l)
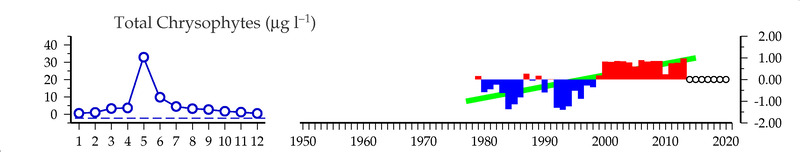
Total Chrysophyceae (ug/l)
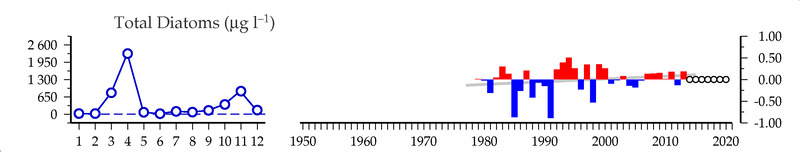
Total Diatomophyceae (ug/l)
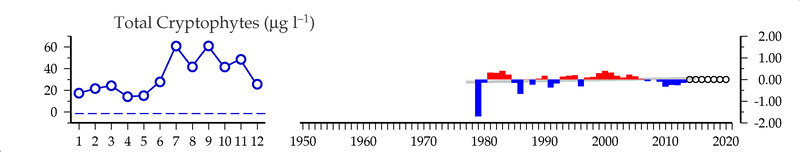
Total Cryptophyceae (ug/l)
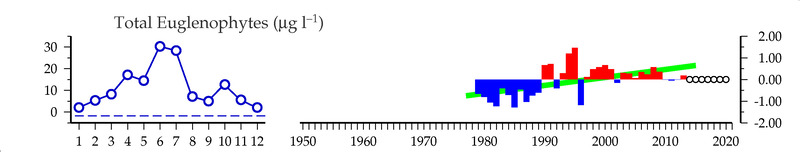
Total Euglenophyceae (ug/l)
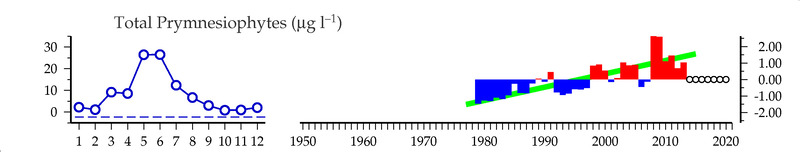
Total Prymnesiophyceae (ug/l)
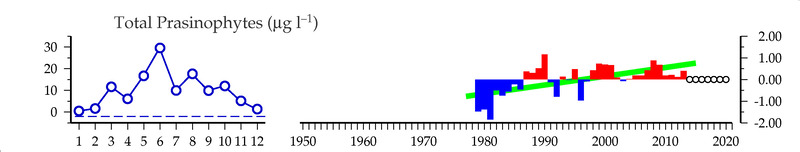
Total Prasinophyceae (ug/l)
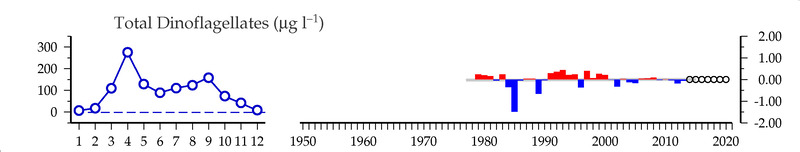
Total Dinophyceae (ug/l)
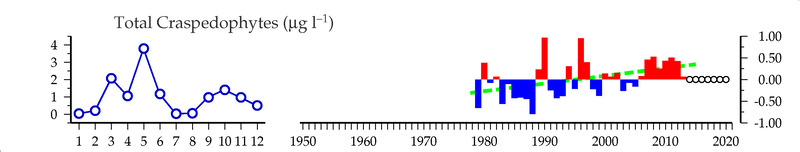
Total Craspedophyceae (ug/l)
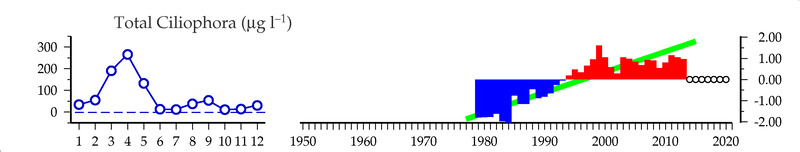
Total Ciliophora (ug/l)
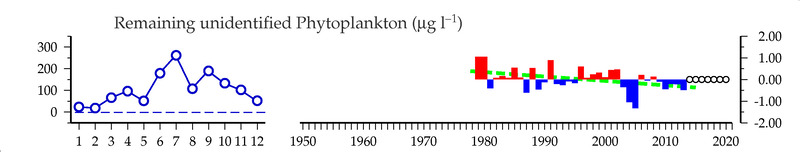
Remaining unidentified Phytoplankton (ug/l)
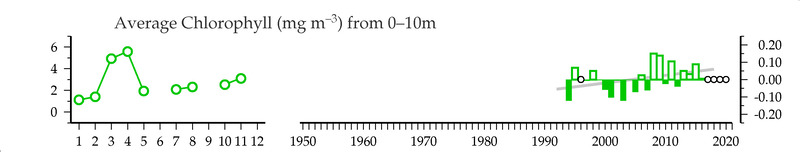
Average Chlorophyll (mg/m3) from 0-10m
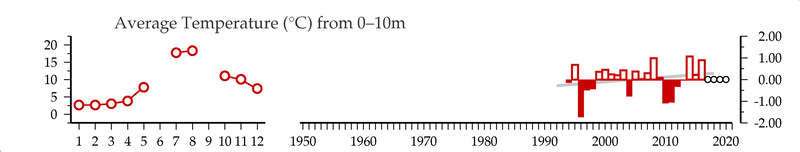
Average Temperature ( C ) from 0-10m
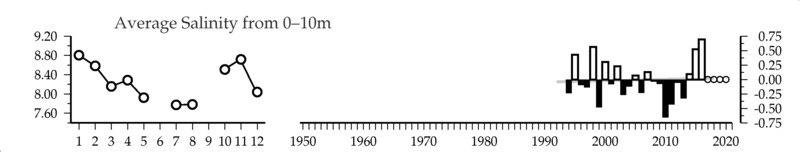
Average Salinity () from 0-10m
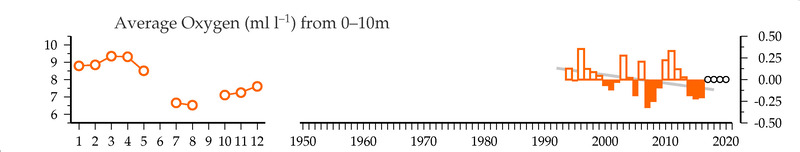
Average Oxygen (ml/l) from 0-10m
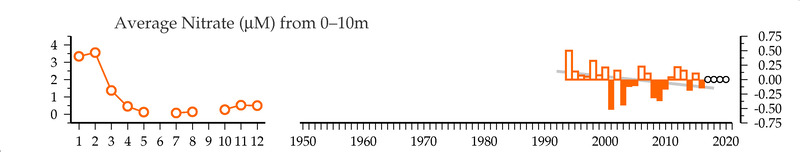
Average NO3 (mmol/m3) from 0-10m
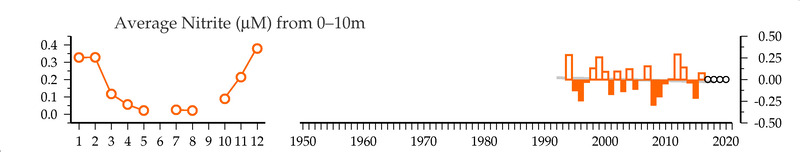
Average NO2 (mmol/m3) from 0-10m
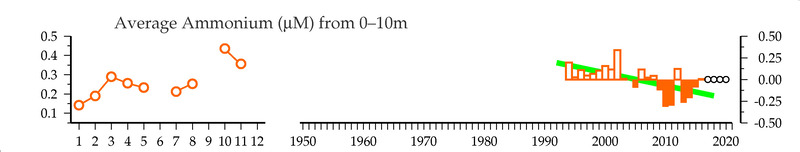
Average NH4 (mmol/m3) from 0-10m
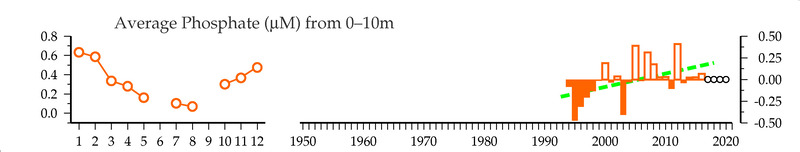
Average PO4 (mmol/m3) from 0-10m
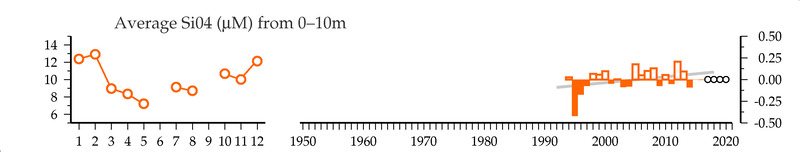
Average Si04 (mmol/m3) from 0-10m
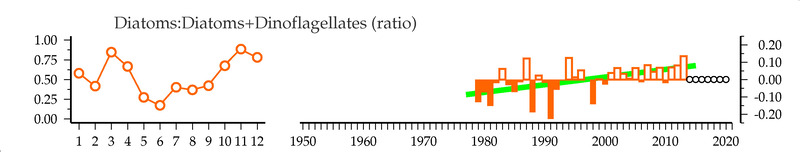
Diatoms:Diatoms+Dinoflagellates (ratio)
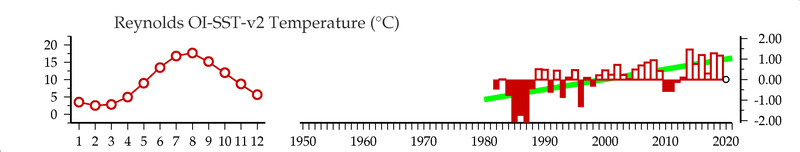
Reynolds OI-SST-v2 Temperature (C)
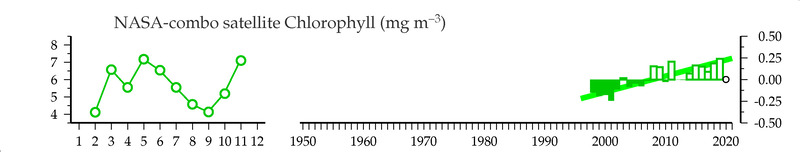
NASA-combo satellite Chlorophyll (mg/m3)
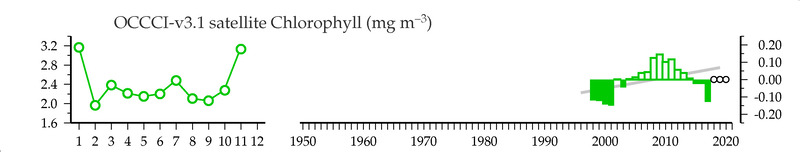
OCCCI-v3.1 satellite Chlorophyll (mg/m3)
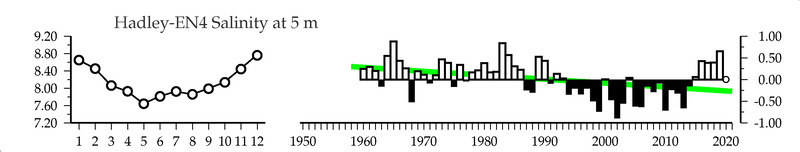
Hadley-EN4 Salinity () at 5 m
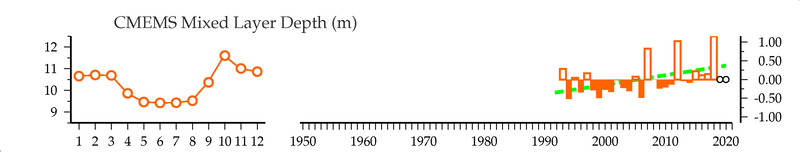
CMEMS Mixed Layer Depth (m)
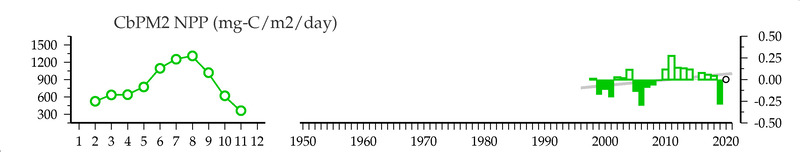
CbPM2 NPP (mg-C/m2/day)
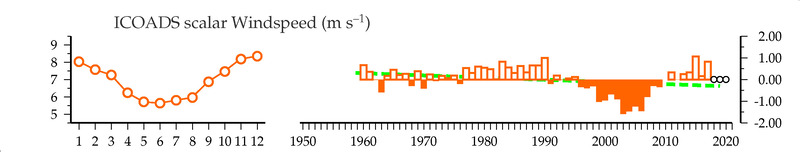
ICOADS scalar Windspeed (m/s)
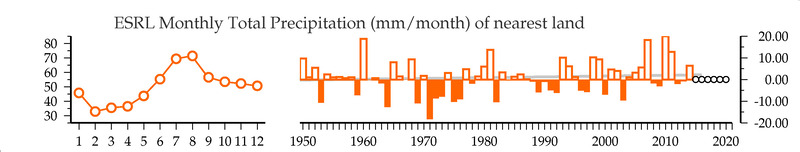
ESRL Monthly Total Precipitation (mm/month) of nearest land
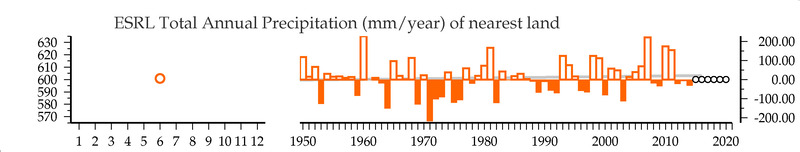
ESRL Total Annual Precipitation (mm/year) of nearest land
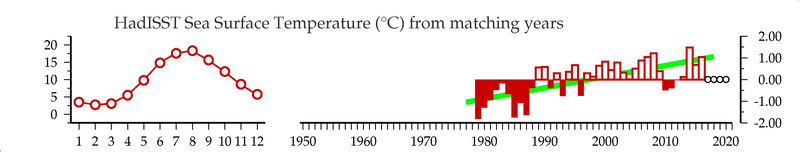
HadISST Sea Surface Temperature (C) from matching years
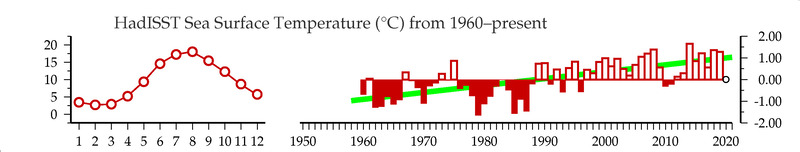
HadISST Sea Surface Temperature (C) from 1960-present
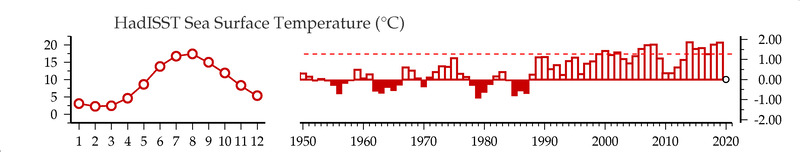
HadISST Sea Surface Temperature (C)
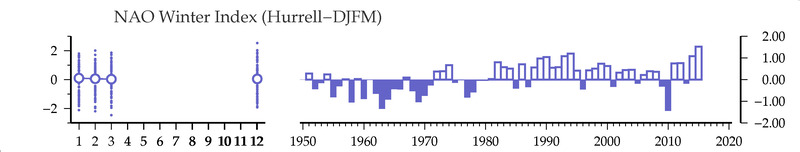
NAO Winter Index
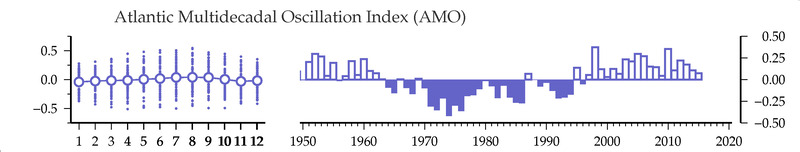
Atlantic Multidecadal Oscillation Index
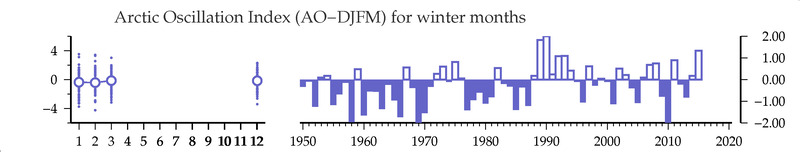
Arctic Oscillation Index (winter months)
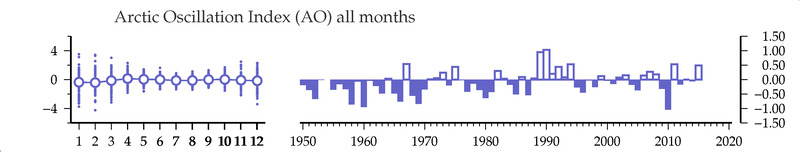
Arctic Oscillation Index
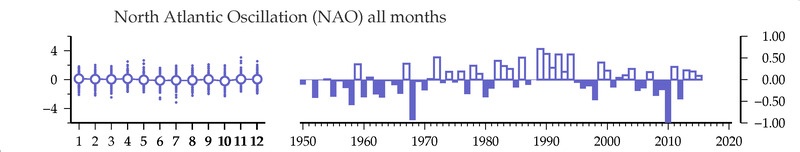
North Atlantic Oscillation