Multi-Variable Comparison & Correlation Plot (MVCCP)
Checked variables will have their figure shown below. Uncheck any variable to remove its plot from below.
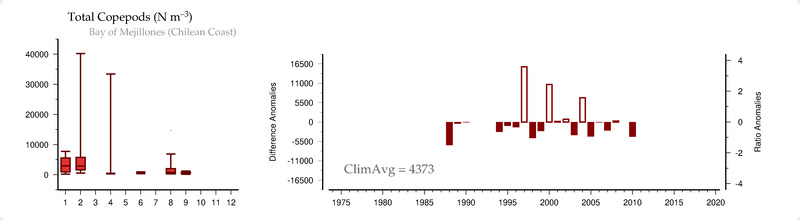
Total Copepods (#/m3)
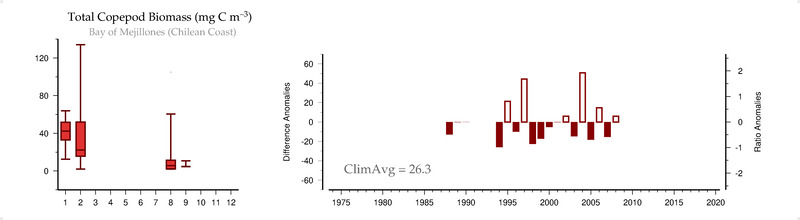
Total Copepod Biomass (mg-C/m3)
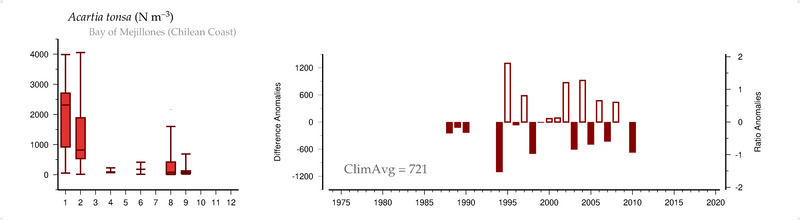
Acartia tonsa (#/m3)
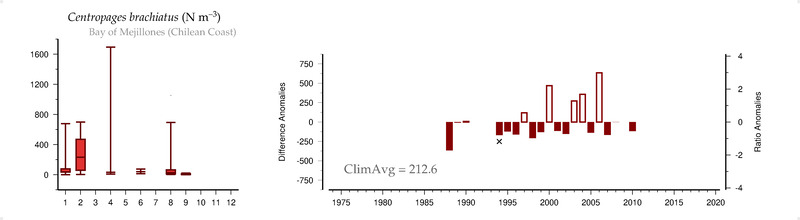
Centropages brachiatus (#/m3)
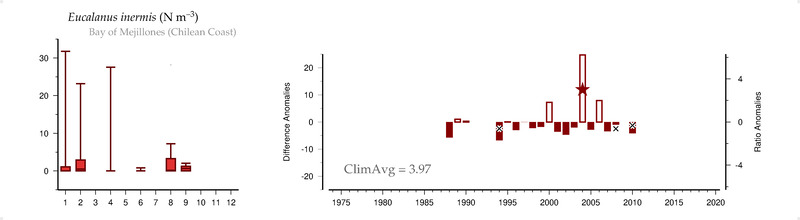
Eucalanus inermis (#/m3)
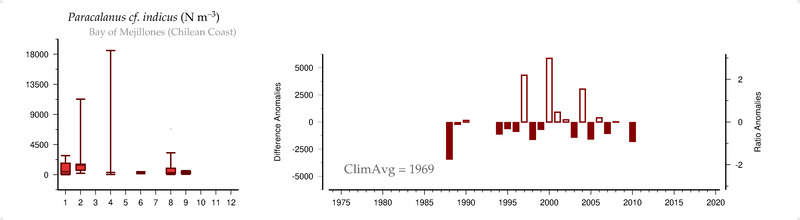
Paracalanus cf. indicus (#/m3)
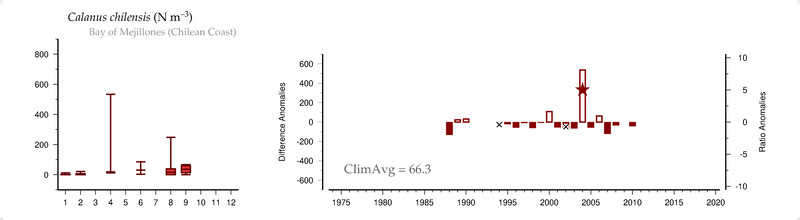
Calanus chilensis (#/m3)
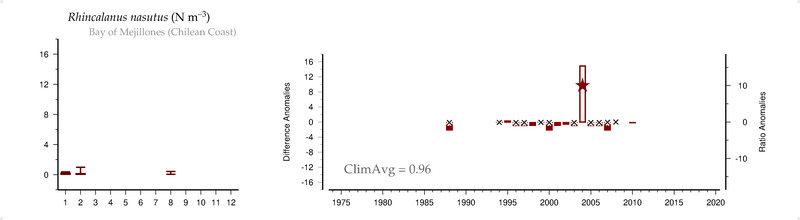
Rhincalanus nasutus (#/m3)
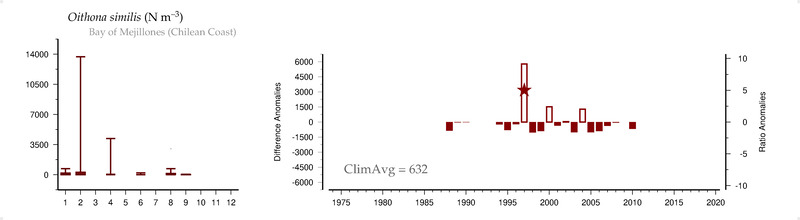
Oithona similis (#/m3)
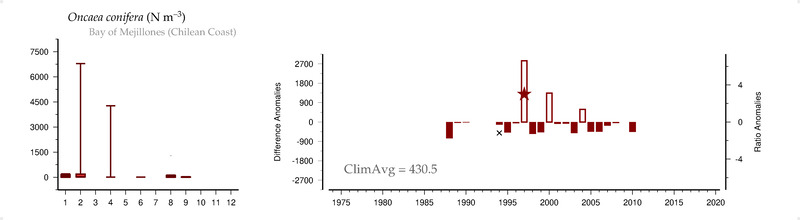
Oncaea conifera (#/m3)
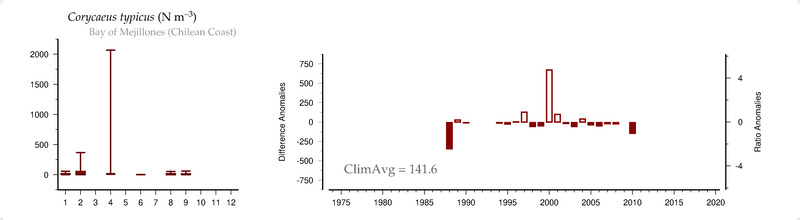
Corycaeus typicus (#/m3)
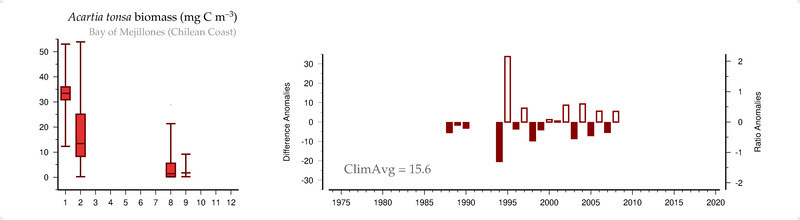
Acartia tonsa biomass (mg-C/m3)
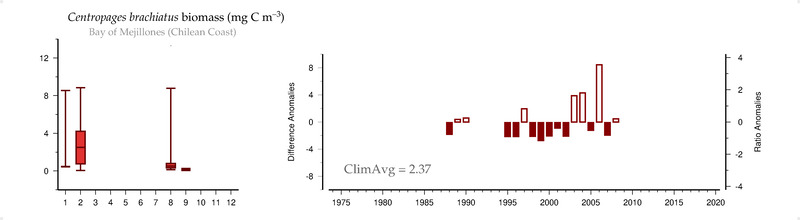
Centropages brachiatus biomass (mg-C/m3)
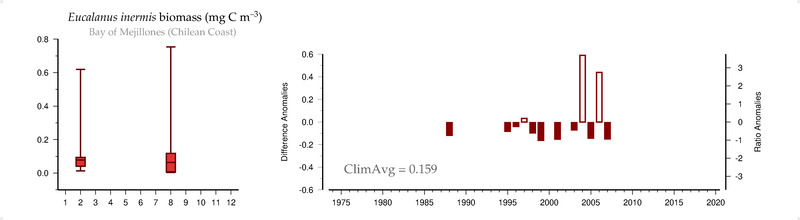
Eucalanus inermis biomass (mg-C/m3)
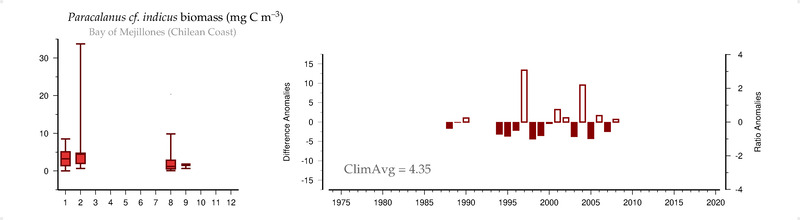
Paracalanus cf. indicus biomass (mg-C/m3)
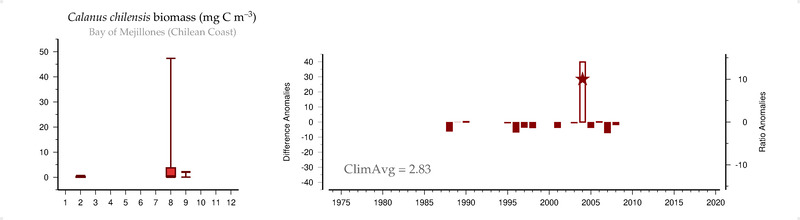
Calanus chilensis biomass (mg-C/m3)
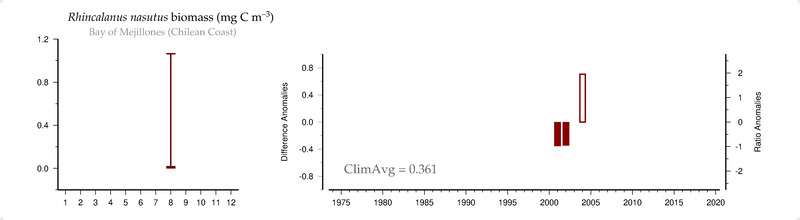
Rhincalanus nasutus biomass (mg-C/m3)
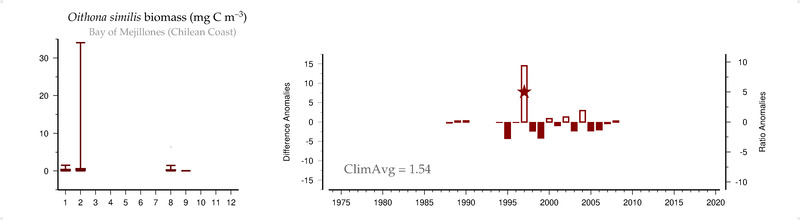
Oithona similis biomass (mg-C/m3)
Oncaea conifera biomass (mg-C/m3)
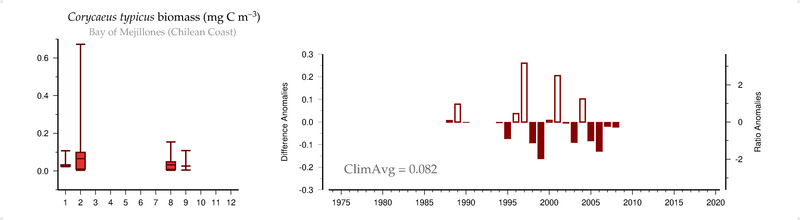
Corycaeus typicus biomass (mg-C/m3)
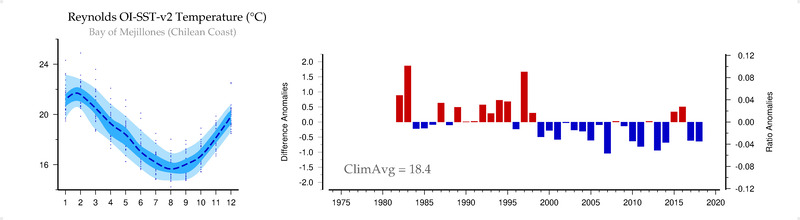
Reynolds OI-SST-v2 Temperature (C)
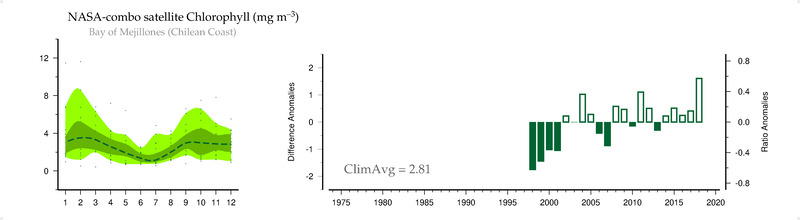
NASA-combo satellite Chlorophyll (mg/m3)
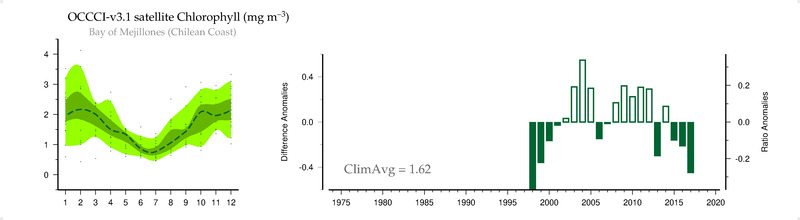
OCCCI-v3.1 satellite Chlorophyll (mg/m3)
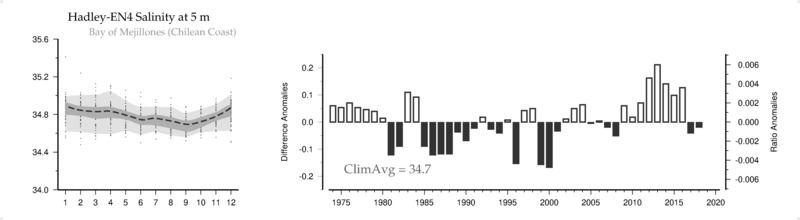
Hadley-EN4 Salinity () at 5 m
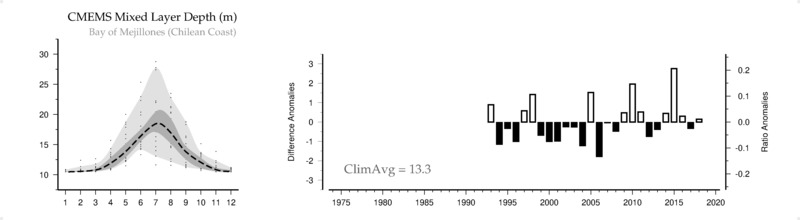
CMEMS Mixed Layer Depth (m)
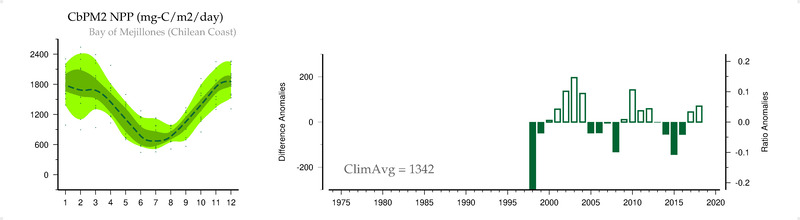
CbPM2 NPP (mg-C/m2/day)
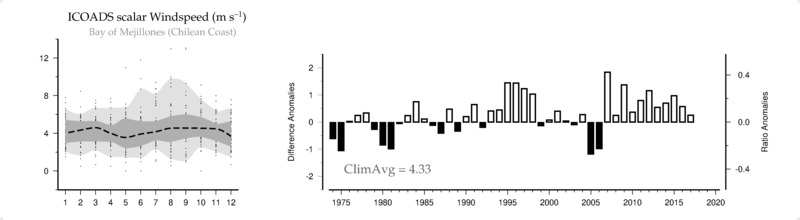
ICOADS scalar Windspeed (m/s)
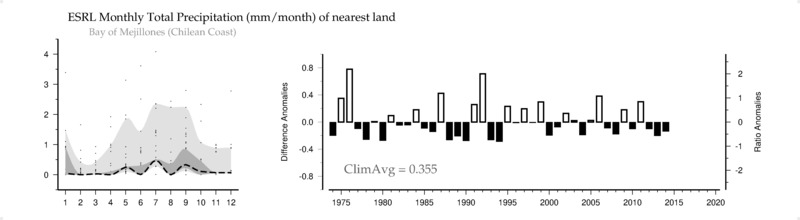
ESRL Monthly Total Precipitation (mm/month) of nearest land
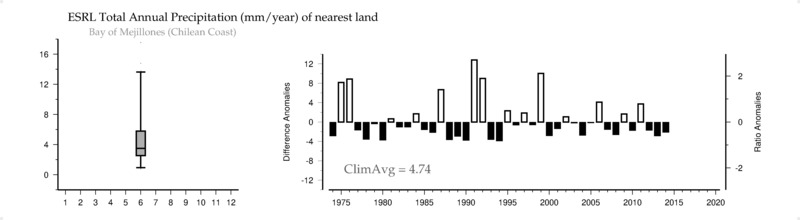
ESRL Total Annual Precipitation (mm/year) of nearest land
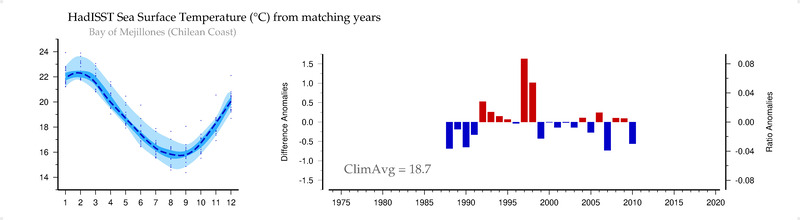
HadISST Sea Surface Temperature (C) from matching years
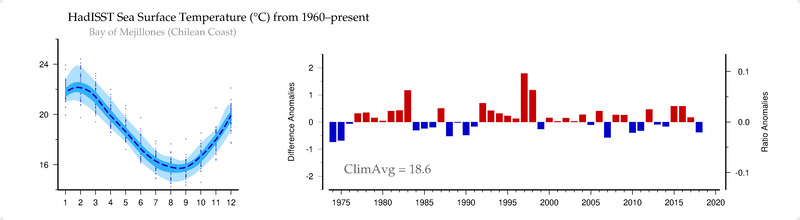
HadISST Sea Surface Temperature (C) from 1960-present
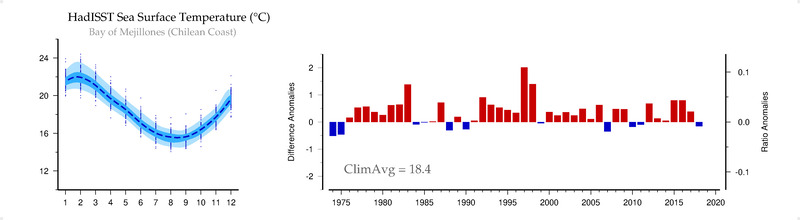
HadISST Sea Surface Temperature (C)