Multi-Variable Comparison & Correlation Plot (MVCCP)
Checked variables will have their figure shown below. Uncheck any variable to remove its plot from below.
Total Copepods (#/m2)
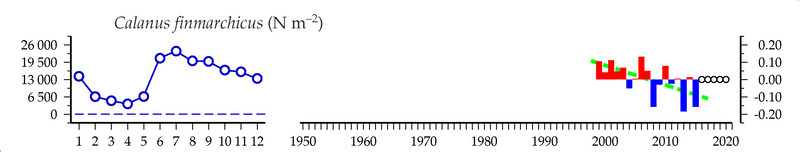
Calanus finmarchicus (#/m2)
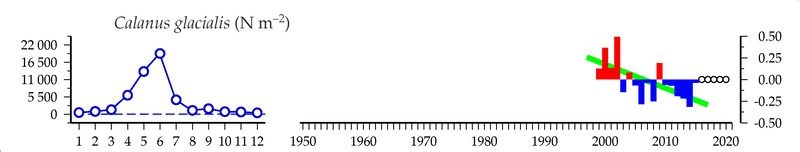
Calanus glacialis (#/m2)
Calanus hyperboreus (#/m2)
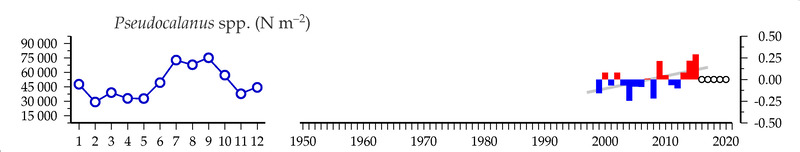
Pseudocalanus spp. (#/m2)
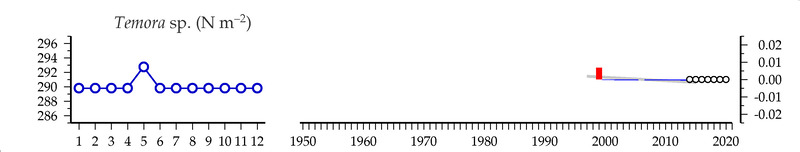
Temora sp. (#/m2)
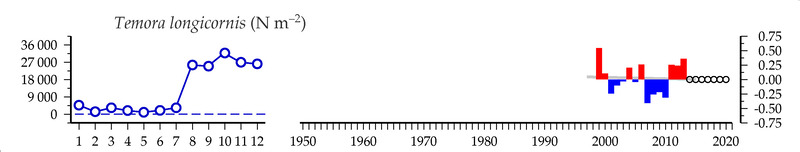
Temora longicornis (#/m2)
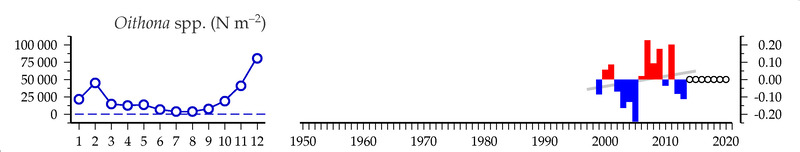
Oithona spp. (#/m2)
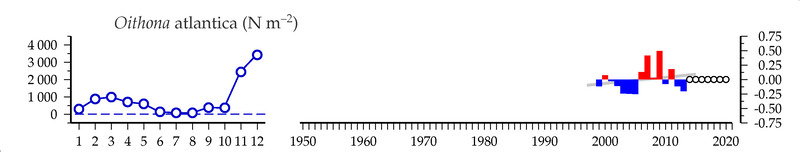
Oithona atlantica (#/m2)
Oithona similis (#/m2)
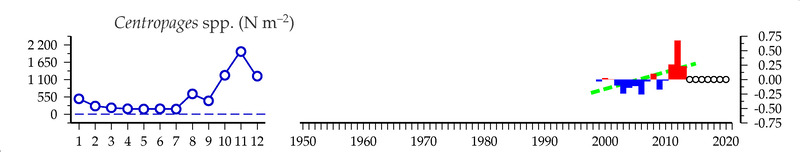
Centropages spp. (#/m2)
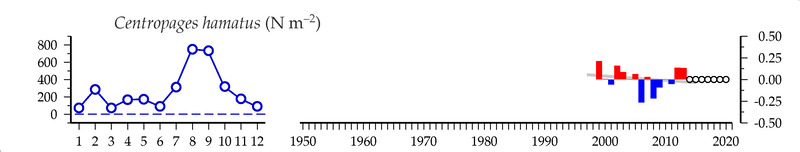
Centropages hamatus (#/m2)
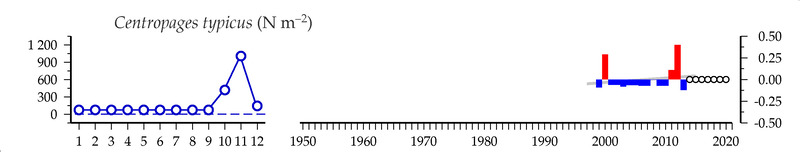
Centropages typicus (#/m2)
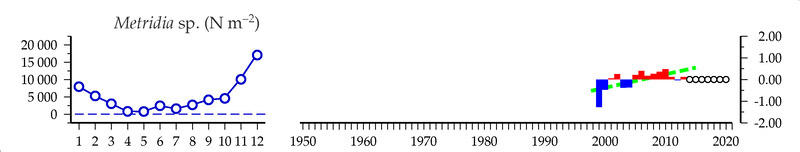
Metridia sp. (#/m2)
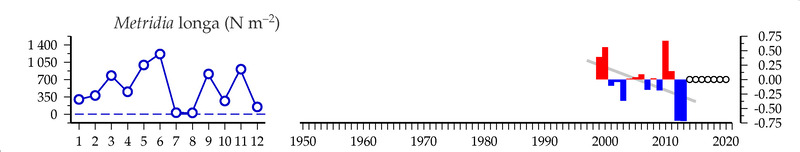
Metridia longa (#/m2)
Metridia lucens (#/m2)
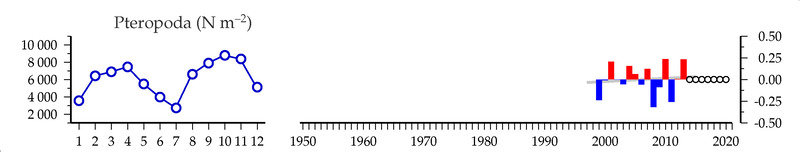
Pteropoda (#/m2)
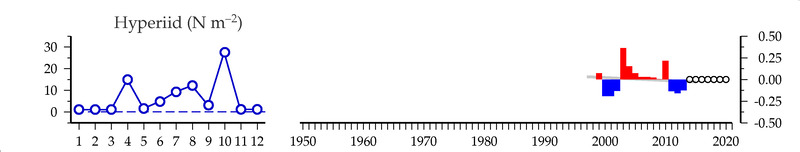
Hyperiid (#/m2)
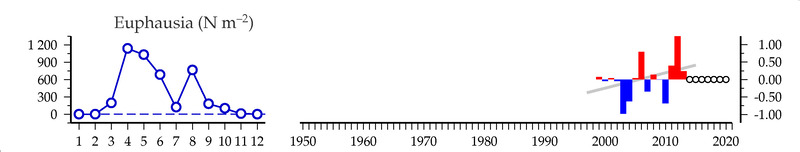
Euphausia (#/m2)
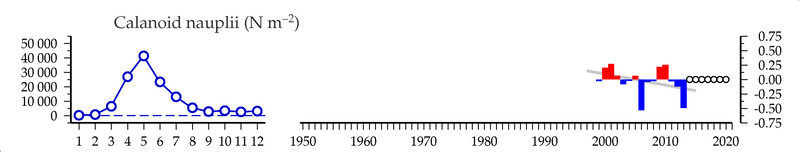
Calanoid nauplii (#/m2)
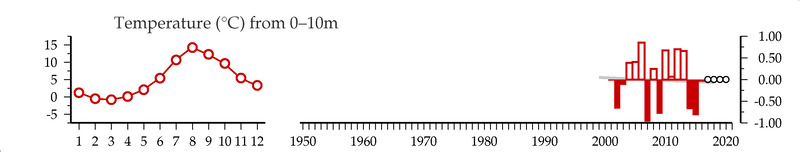
Temperature (C) from 0-10m
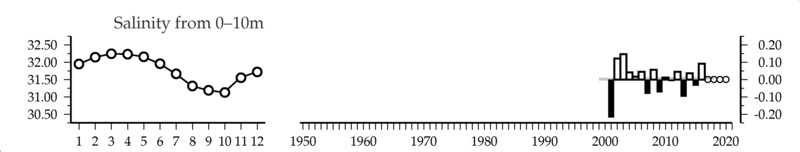
Salinity () from 0-10m
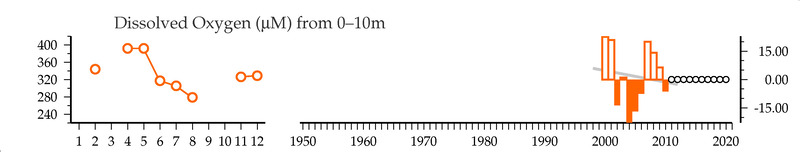
Dissolved Oxygen (mmol/m3) from 0-10m
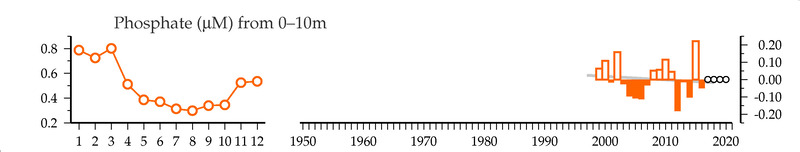
Phosphate (mmol/m3) from 0-10m
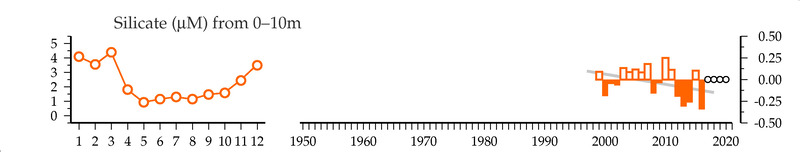
Silicate (mmol/m3) from 0-10m
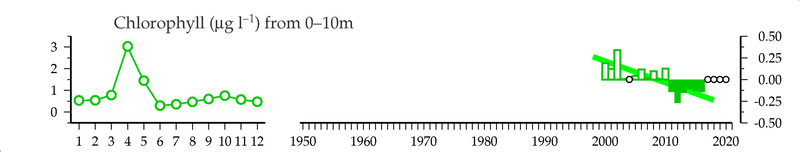
Chlorophyll (ug/l) from 0-10m
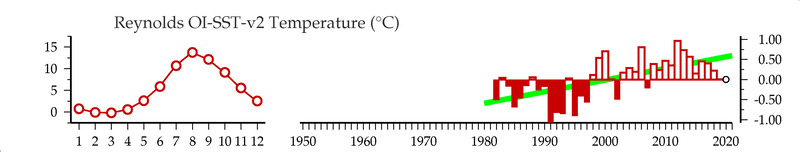
Reynolds OI-SST-v2 Temperature (C)
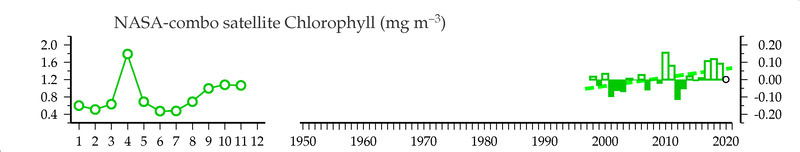
NASA-combo satellite Chlorophyll (mg/m3)
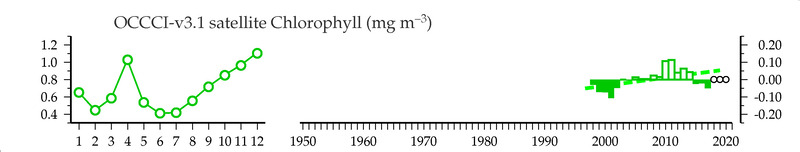
OCCCI-v3.1 satellite Chlorophyll (mg/m3)
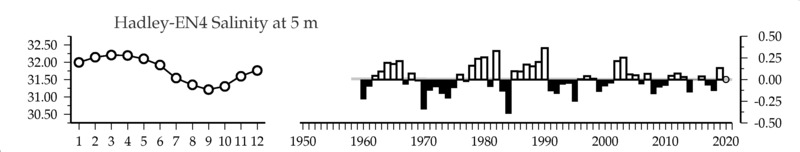
Hadley-EN4 Salinity () at 5 m
CMEMS Mixed Layer Depth (m)
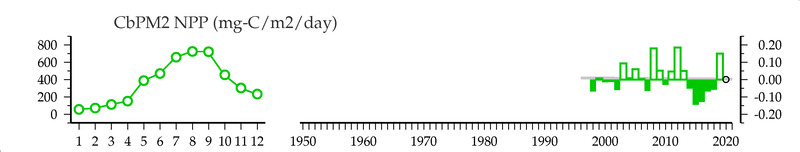
CbPM2 NPP (mg-C/m2/day)
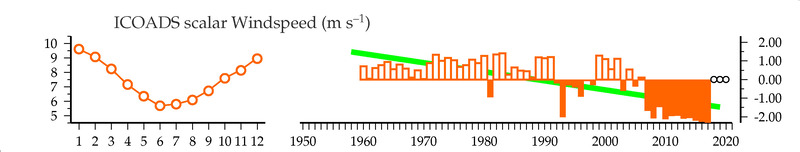
ICOADS scalar Windspeed (m/s)
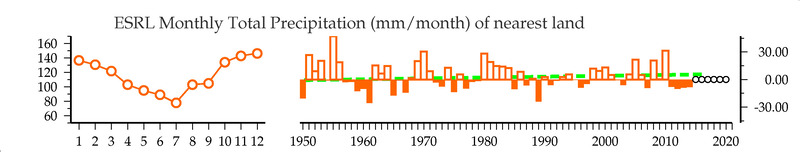
ESRL Monthly Total Precipitation (mm/month) of nearest land
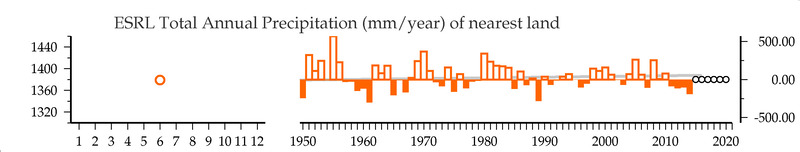
ESRL Total Annual Precipitation (mm/year) of nearest land
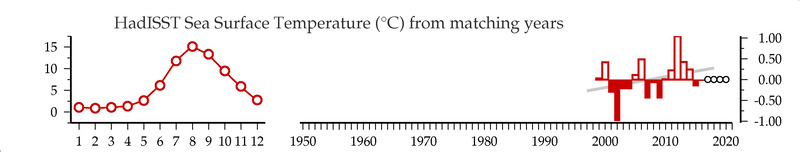
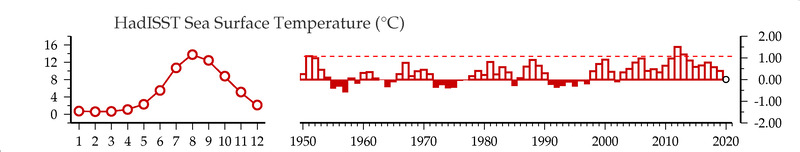
HadISST Sea Surface Temperature (C) from matching years
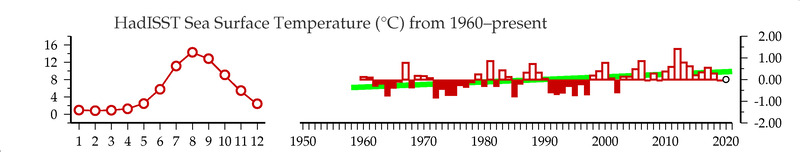
HadISST Sea Surface Temperature (C) from 1960-present
HadISST Sea Surface Temperature (C)
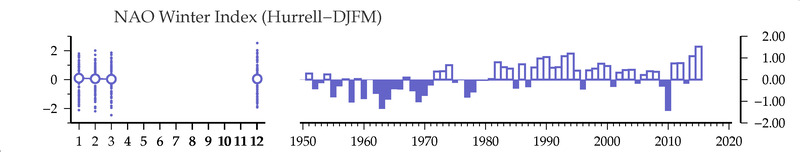
NAO Winter Index
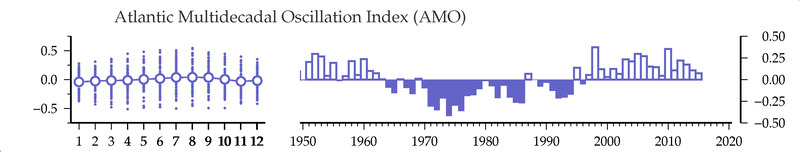
Atlantic Multidecadal Oscillation Index
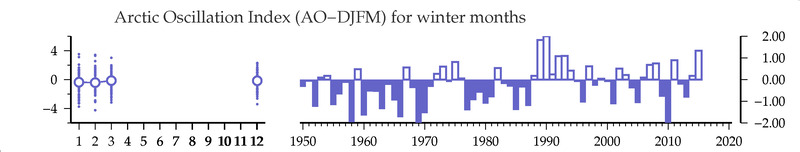
Arctic Oscillation Index (winter months)
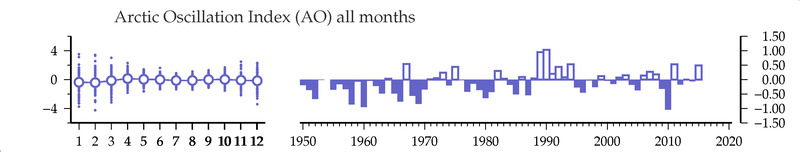
Arctic Oscillation Index
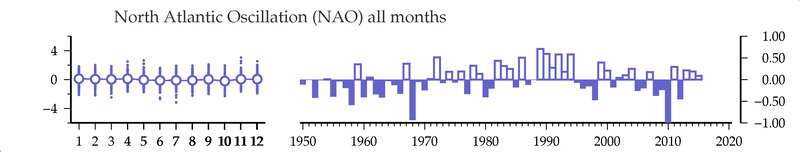
North Atlantic Oscillation