Multi-Variable Comparison & Correlation Plot (MVCCP)
Checked variables will have their figure shown below. Uncheck any variable to remove its plot from below.
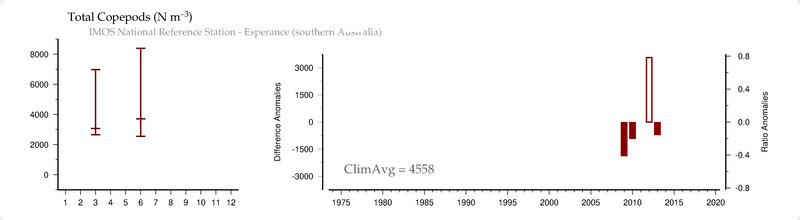
Total Copepods (#/m3)
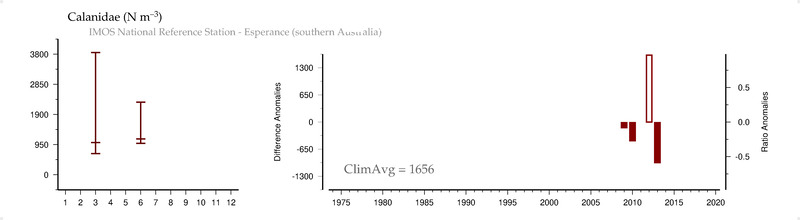
Calanidae (#/m3)
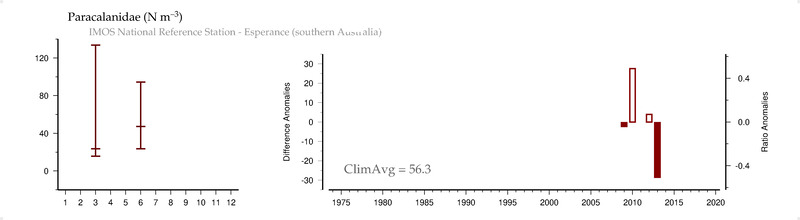
Paracalanidae (#/m3)
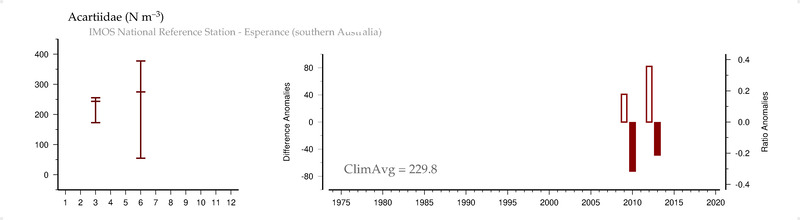
Acartiidae (#/m3)
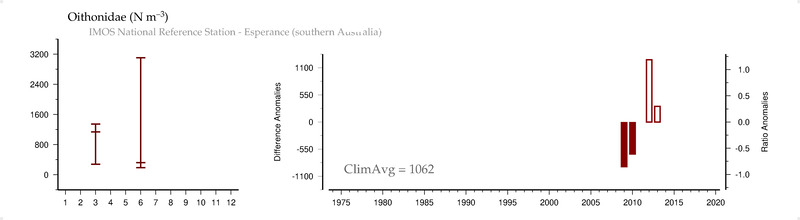
Oithonidae (#/m3)
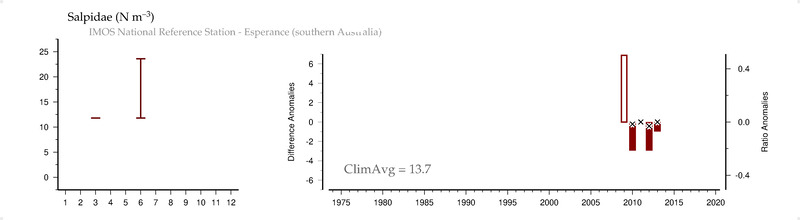
Salpidae (#/m3)
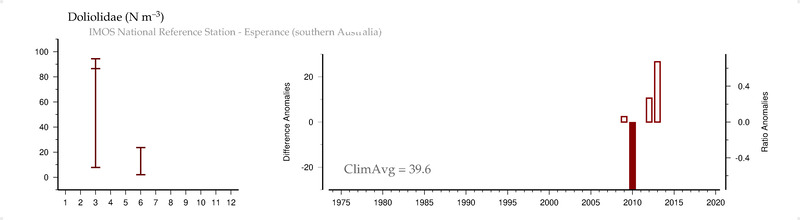
Doliolidae (#/m3)
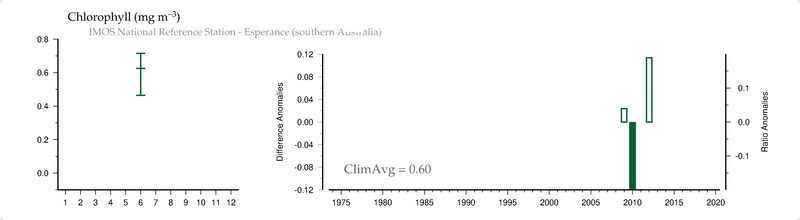
Chlorophyll (mg/m3)
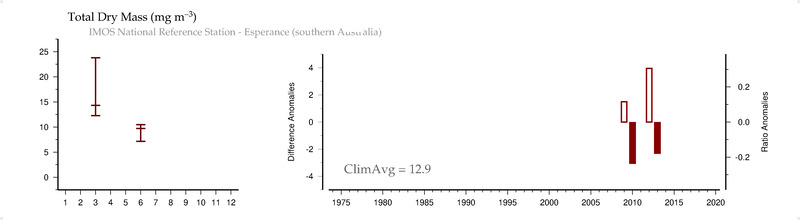
Total Dry Mass (mg/m3)
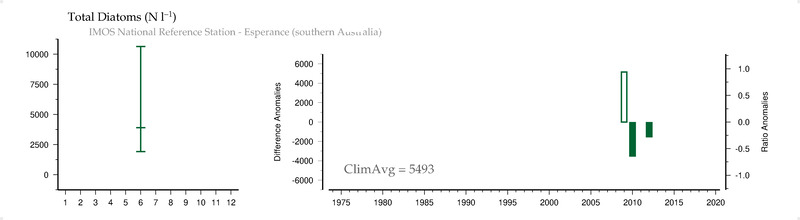
Total Diatoms (#/L)
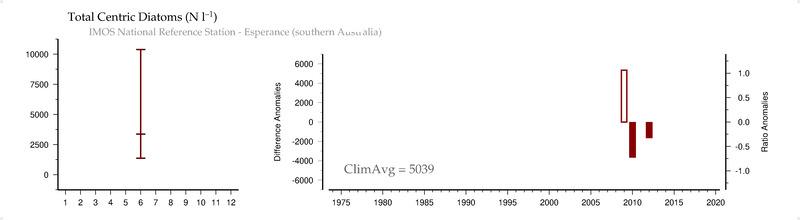
Total Centric Diatoms (#/L)
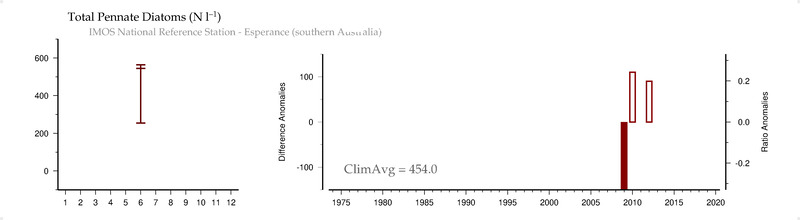
Total Pennate Diatoms (#/L)
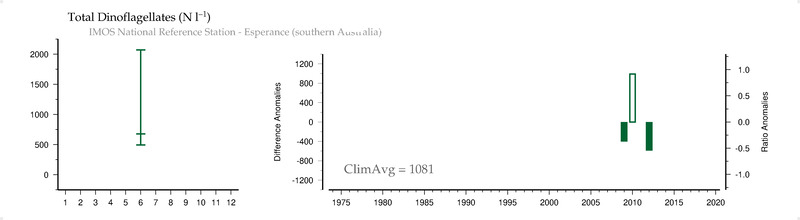
Total Dinoflagellates (#/L)
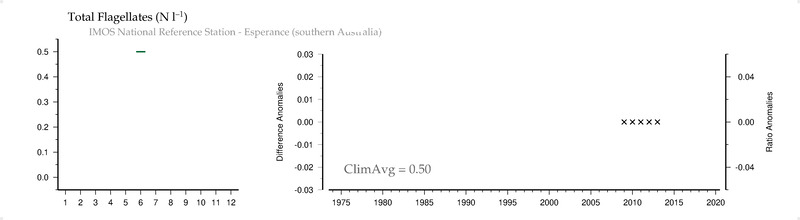
Total Flagellates (#/L)
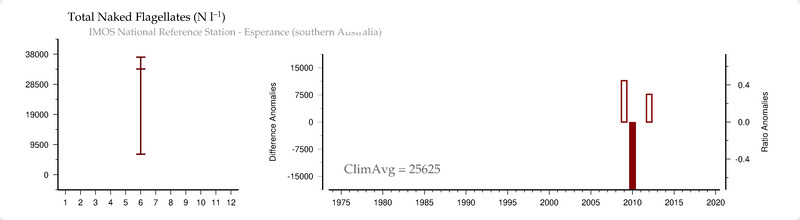
Total Naked Flagellates (#/L)
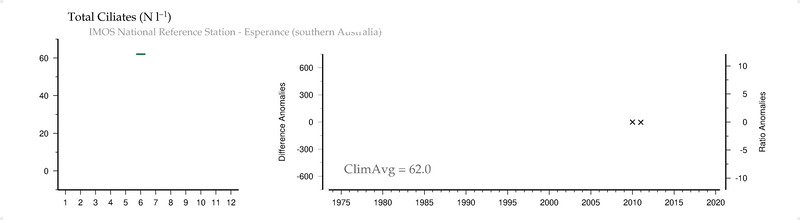
Total Ciliates (#/L)
Total Coccolithophore (#/L)
Total Cyanobacteria (#/L)
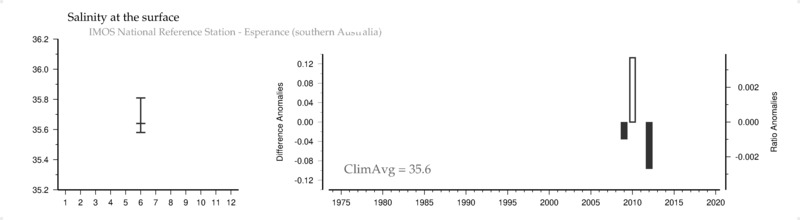
Salinity () at the surface
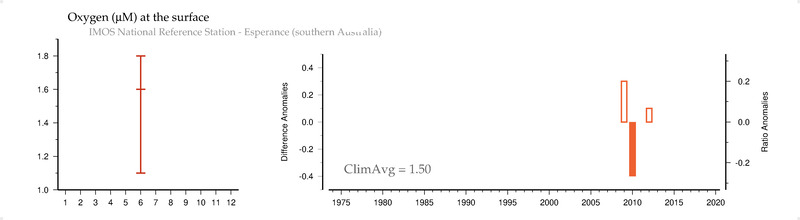
Oxygen (uM) at the surface
Silicate (uM) at the surface
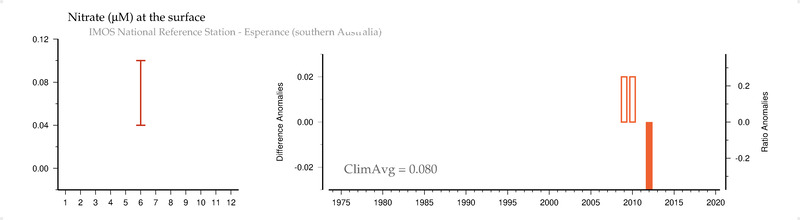
Nitrate (uM) at the surface
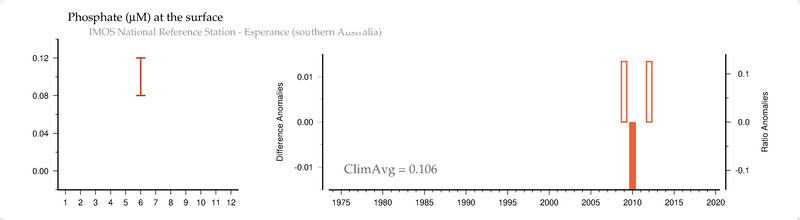
Phosphate (uM) at the surface
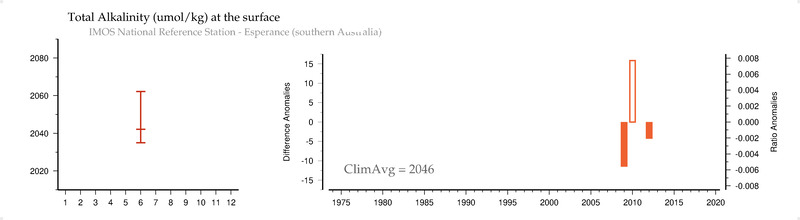
Total Alkalinity (umol/kg) at the surface
Temperature () at the surface
Salinity () at the surface
Fluorometric Chlorophyll () at the surface
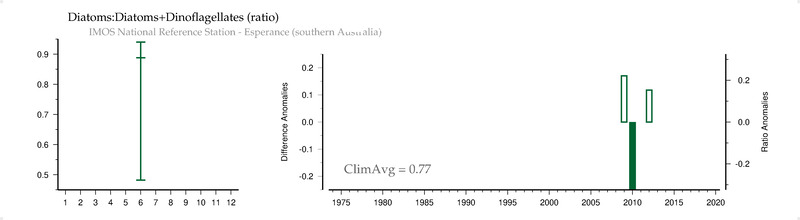
Diatoms:Diatoms+Dinoflagellates (ratio)
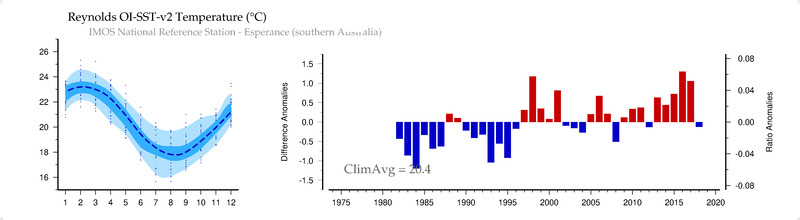
Reynolds OI-SST-v2 Temperature (C)
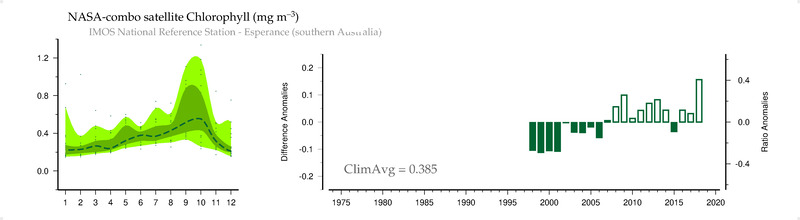
NASA-combo satellite Chlorophyll (mg/m3)
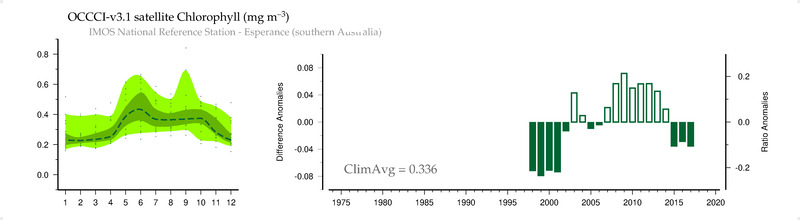
OCCCI-v3.1 satellite Chlorophyll (mg/m3)
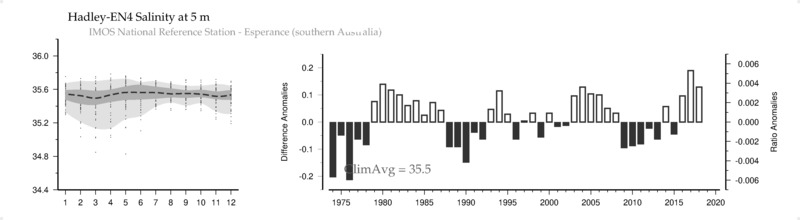
Hadley-EN4 Salinity () at 5 m
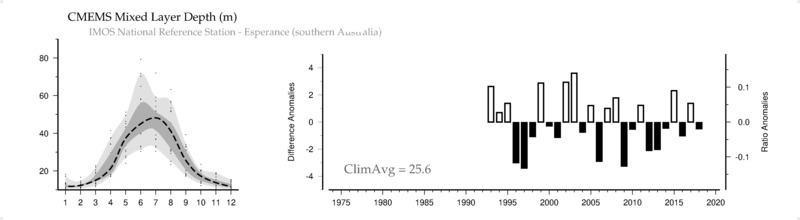
CMEMS Mixed Layer Depth (m)
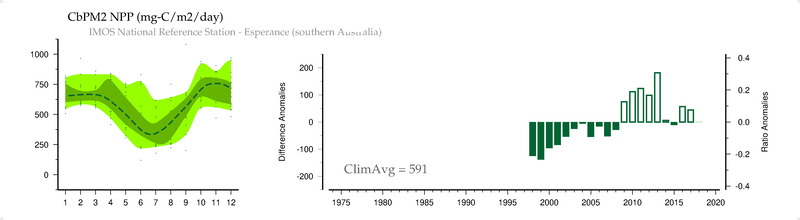
CbPM2 NPP (mg-C/m2/day)
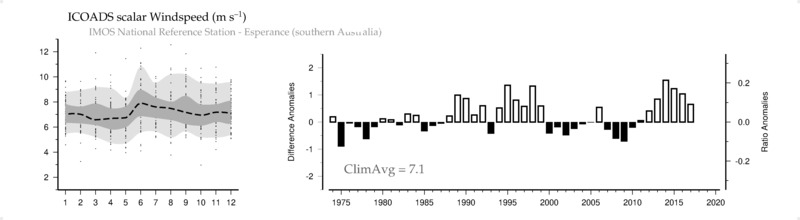
ICOADS scalar Windspeed (m/s)
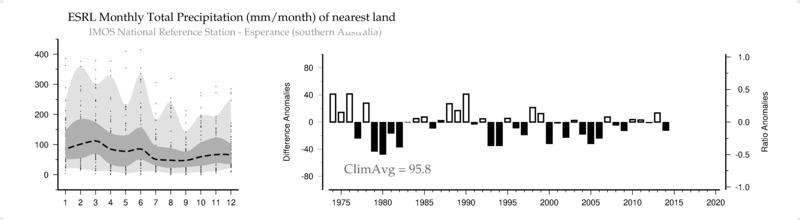
ESRL Monthly Total Precipitation (mm/month) of nearest land
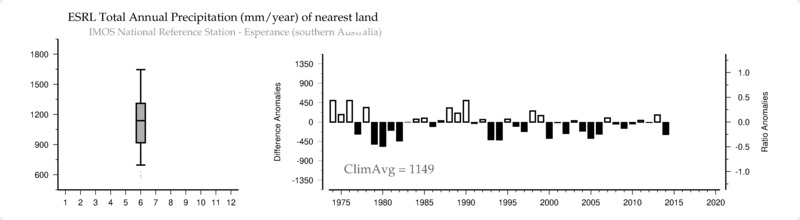
ESRL Total Annual Precipitation (mm/year) of nearest land
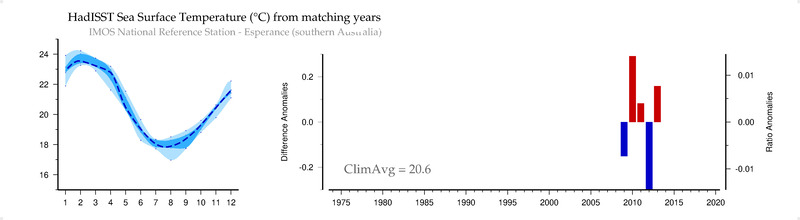
HadISST Sea Surface Temperature (C) from matching years
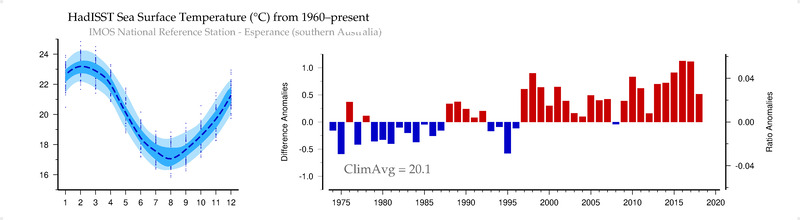
HadISST Sea Surface Temperature (C) from 1960-present
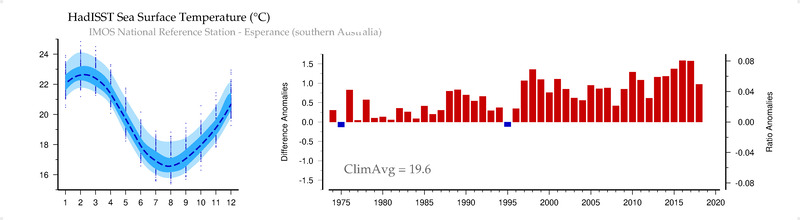
HadISST Sea Surface Temperature (C)