How to select a variable, grid-resolution, and figure type
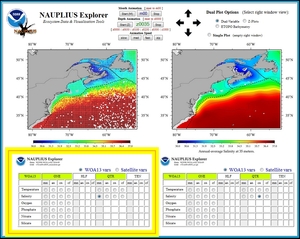
Below each NAUPLIUS Explorer map window (top right figure) is a figure selection menubox.
At the top of this menubox (middle right figure) you can select from different variable sets.
Within the menubox (bottom right figure), you can select an individual variable, resolution, and plot.
NAUPLIUS "Variable Sets":
WOA13 vars - contains the World Ocean Atlas 2013 data set.
Satellite vars - offers a selection of surface-only satellite and satellite/model-based data sets.
COPEPOD vars (coming soon) - offers in situ chlorophyll and zooplankton biomass fields.
NAUPLIUS Variables, Grid-Resolutions, and Plot Types:
-
Selecting a Variable -
The first column of the menubox contains abbreviated variable names for the available variables (e.g., "Temperature", "Phosphate", "NASA Chl-a").
The columns within each row then contain multiple buttons for selecting the grid-sizes (ONE/HLF/QTR/TEN) and plot-types (dm/cn/cc/cf) available for that variable.
-
Selecting a Grid-Resolution -
The menubox table rows contains four repeating groups of four buttons each, with table headings of ONE, HLF, QTR, and TEN.
Selecting a button within one of these four major groupings will plot data at a ONE (1-degree, ~100km x 100km), HLF (0.5-degree, ~50km x50km), QTR (0.25-degree, ~25km x 25km), or TEN (0.1-degree, ~10km x 10km) degree latitude-longitude gridding resolution.
If a button is not available for a given resolution, data are not available at that resolution.
-
Selecting a Plot Type -
Repeating within each grid-resolution column-set are four plot types ("dm", "cn", "cc", "cf") that when selected will display the following figure types:
| |
- dm - dot-plot (d) of statistical means (m), without any spatial filling or interpolation
- cn - contour-plot (c) with no (n) black contour intervals highlighted
- cc - contour-plot (c) with coarse (c) black contour intervals highlighted
- cf - contour-plot (c) with fine (f) black contour intervals highlighted
|
|