|
|
|
Standard Analysis and Visualization of Plankton Time-Series Methods and Visualizations of COPEPOD-related Time Series Projects |
|
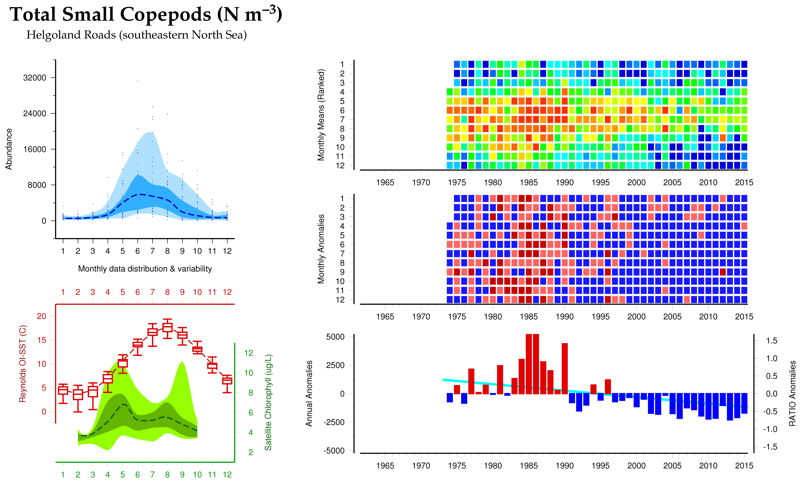
These "COPEPOD/COPEPODITE/WG125/WGZE/WG137/WGPME/IGMETS Standard Time-series Analysis and Visualization Methods" were designed to allow for easy comparison of plankton (and other hydrographic variables) of different types, methods, and sampling frequencies (e.g., "biomass sampled three times per year" vs. "copepod abundance sampled weekly").
This is accomplished by looking at relative changes in the data values within a single time-series, relative to the long term average of those data, optionally expressed as a unit-less ratio or anomaly. The standard plankton, biogeochemical, and hydrographic time series analyses and graphical visualizations used by COPEPODITE were initially developed in collaboration with multiple SCOR and ICES plankton time series working groups. At this time, a comprehensive "methods" document does not exist, but it is in the works. Until this is available, we will redirect you to the reports and publications that use, contain, and describe these techniques. Related Publications: |
|
|
REFERENCES: (from most-recent to oldest)
O'Brien, T.D. and Oakes, S.A. 2020. Visualizing and exploring zooplankton spatio-temporal variability. In Zooplankton Ecology (pp. 192-224). CRC Press. [book chapter]
O'Brien, T.D., Lorenzoni, L., Isensee, K., and Valdes, L. (Eds). 2017.
What are Marine Ecological Time Series telling us about the ocean? A status report. IOC-UNESCO, IOC Technical Serices, No. 129: 297pp. Paerl, H.W., K. Yin, T.D. O'Brien, SCOR Working Group 137: "Global Patterns of Phytoplankton Dynamics in Coastal Ecosystems": An introduction to the special issue of Estuarine, Coastal and Shelf Science, Estuarine, Coastal and Shelf Science, Volume 162, 5 September 2015, Pages 1-3, ISSN 0272-7714, https://dx.doi.org/10.1016/j.ecss.2015.07.011
O'Brien, T.D., Wiebe, P.H., and Falkenhaug, T. (Eds). 2013. ICES Zooplankton Status Report 2010/2011. ICES Cooperative Research Report No. 318. 208 pp.
Mackas, D.L., P. Pepin, H. Verheye, Interannual variability of marine zooplankton and their environments: Within- and between-region comparisons, Progress in Oceanography, Volumes 97-100, May-July 2012, Pages 1-14, ISSN 0079-6611, https://dx.doi.org/10.1016/j.pocean.2011.11.002">https://dx.doi.org/10.1016/j.pocean.2011.11.002
O'Brien, T.D., Li, W.K.W., and Morán, X.A.G. (Eds). 2012. ICES Phytoplankton and Microbial Plankton Status Report 2009/2010. ICES Cooperative Research Report No. 313. 196 pp.
O'Brien, T.D., Wiebe, P.H., and Hay, S. (Eds). 2010. ICES Zooplankton Status Report 2008/2009. ICES Cooperative Research Report No. 307. 152 pp.
O'Brien, T.D., Lopez-Urrutia, A., Wiebe, P.H., and Hay, S. (Eds). 2008. ICES Zooplankton Status Report 2006/2007. ICES Cooperative Research Report No. 292. 168 pp. Mackas, D. L., Thomson, R. E., and Galbraith, M. 2001. Changes in the zooplankton community of the British Columbia continental margin, 1985–1999, and their covariation with oceanographic conditions. Canadian Journal of Fisheries and Aquatic Sciences, 58: 685–702 | |