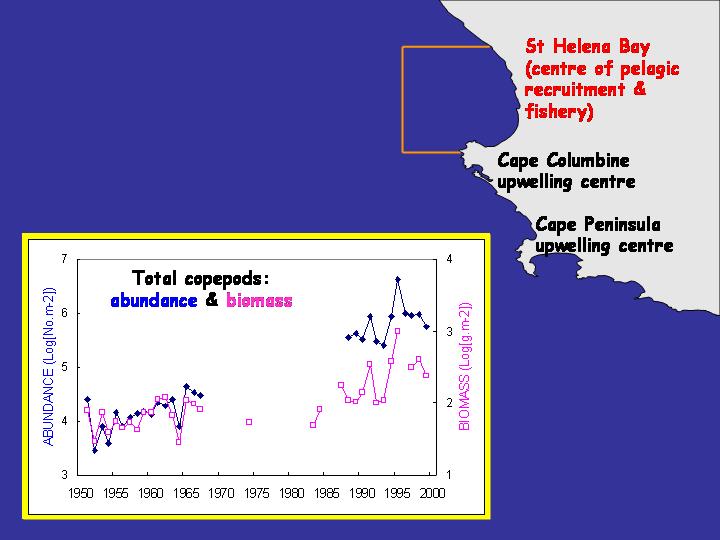
| Figure 3: Long-term time-series of copepod abundance (log10 [No+1 m-2]) and biomass (log10[g dry mass+1 m-2]) in St Helena Bay, 1951-1999 (updated from Verheye et al. 1998 and Verheye and Richardson 1998). |

| Figure 3: Long-term time-series of copepod abundance (log10 [No+1 m-2]) and biomass (log10[g dry mass+1 m-2]) in St Helena Bay, 1951-1999 (updated from Verheye et al. 1998 and Verheye and Richardson 1998). |
