Multi-Variable Comparison & Correlation Plot (MVCCP)
Checked variables will have their figure shown below. Uncheck any variable to remove its plot from below.
Total Wet Mass (g/m2)
Total Dry Mass (g/m2)
Total Carbon Mass (mg/m2)
Total Zoo Nitrogen (mg/m2)
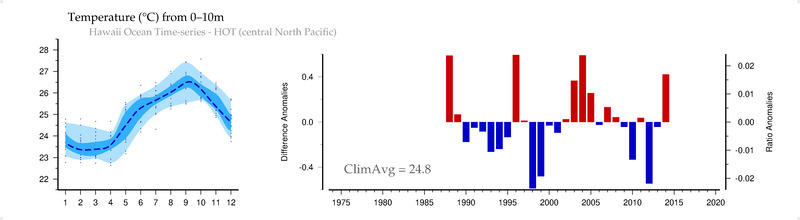
Temperature ( C ) from 0-10m
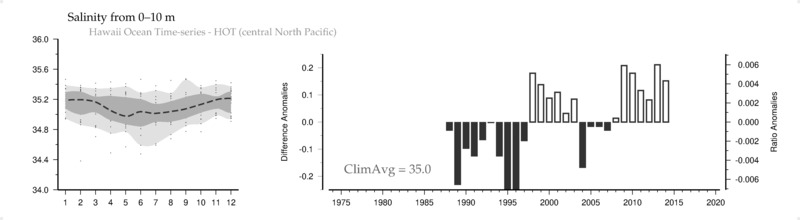
Salinity () from 0-10 m
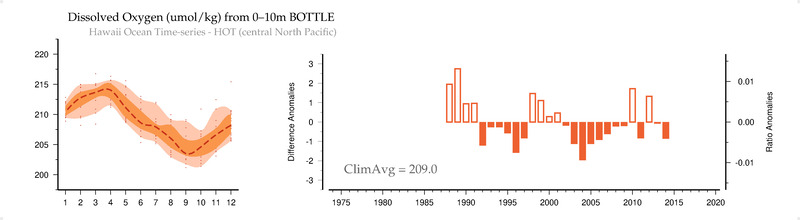
Dissolved Oxygen (umol/kg) from 0-10m BOTTLE
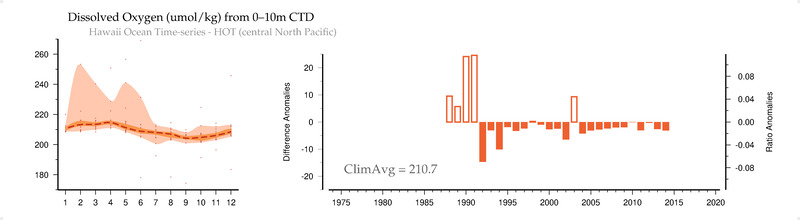
Dissolved Oxygen (umol/kg) from 0-10m CTD
DIC (umol/kg) from 0-10 m
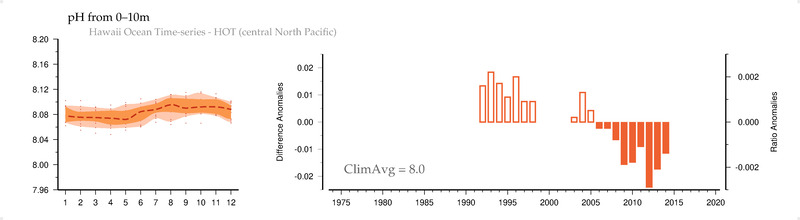
pH () from 0-10m
Alkalinity (ueg/kg) from 0-10m
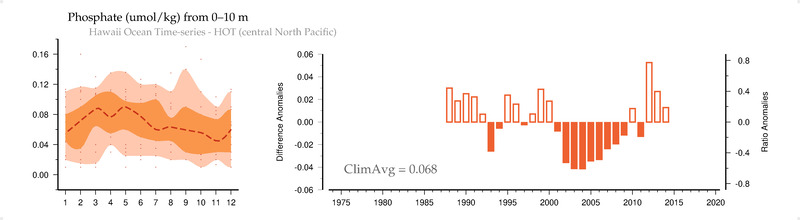
Phosphate (umol/kg) from 0-10 m
NO3+NO2 (umol/kg) from 0-10 m
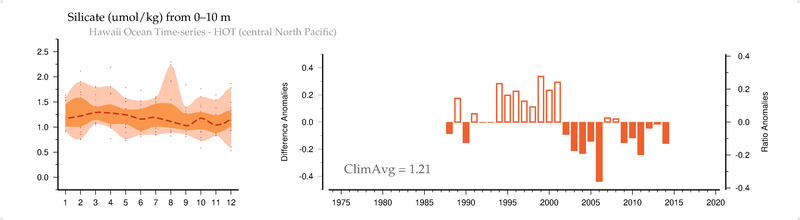
Silicate (umol/kg) from 0-10 m
Chlorophyll (ug/l)
Heterotrophic Bacteria (#/mL)
Prochlorococcus (#/mL)
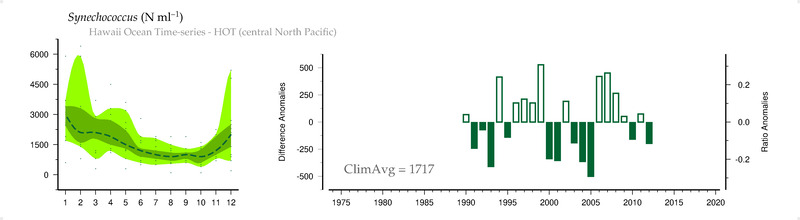
Synechococcus (#/mL)
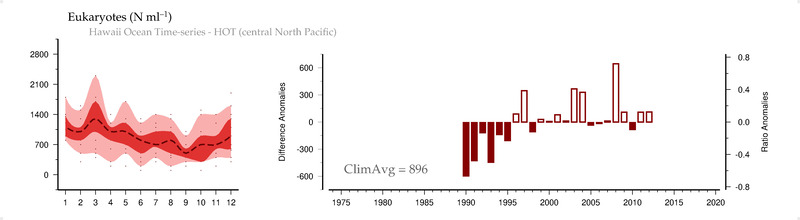
Eukaryotes (#/mL)
Reynolds OI-SST-v2 Temperature (C)
NASA-combo satellite Chlorophyll (mg/m3)
OCCCI-v3.1 satellite Chlorophyll (mg/m3)
Hadley-EN4 Salinity () at 5 m
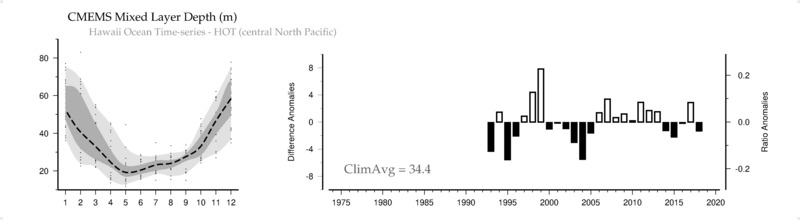
CMEMS Mixed Layer Depth (m)
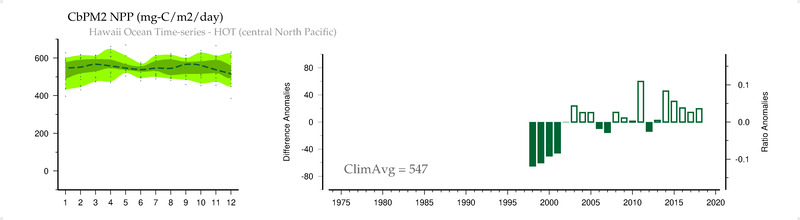
CbPM2 NPP (mg-C/m2/day)
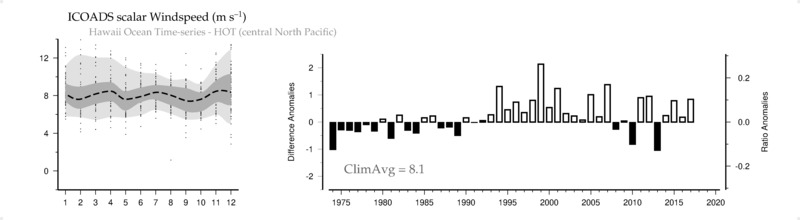
ICOADS scalar Windspeed (m/s)
HadISST Sea Surface Temperature (C) from matching years
HadISST Sea Surface Temperature (C) from 1960-present
HadISST Sea Surface Temperature (C)