Multi-Variable Comparison & Correlation Plot (MVCCP)
Checked variables will have their figure shown below. Uncheck any variable to remove its plot from below.
Total Copepods (#/m3)
Total Calanoids (#/m3)
Calanus finmarchicus C5-6 (#/m3)
Calanus helgolandicus C5-6 (#/m3)
Euphausiids (#/m3)
Cnidaria (#/m3)
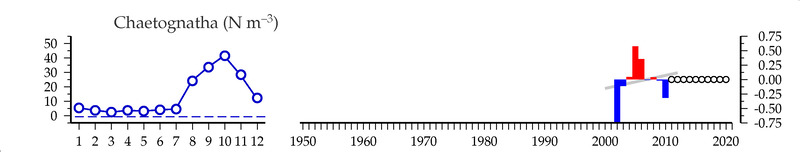
Chaetognatha (#/m3)
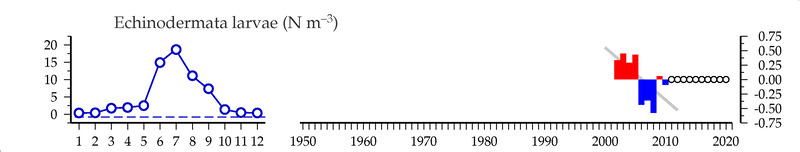
Echinodermata larvae (#/m3)
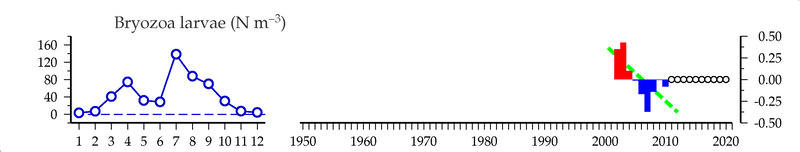
Bryozoa larvae (#/m3)
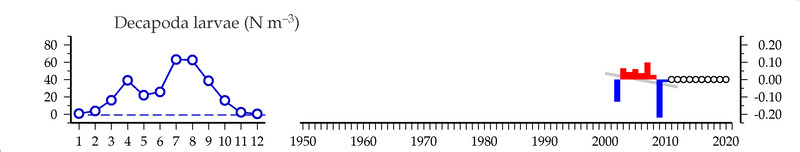
Decapoda larvae (#/m3)
Polychaeta (#/m3)
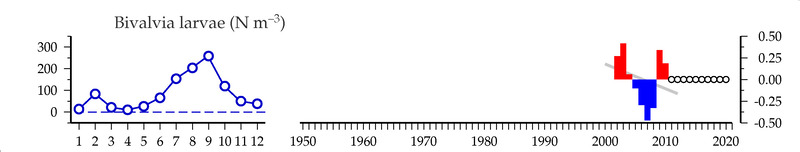
Bivalvia larvae (#/m3)
Pseudocalanus elongatus (#/m3)
Acartia clausii (#/m3)
Cladocerans (#/m3)
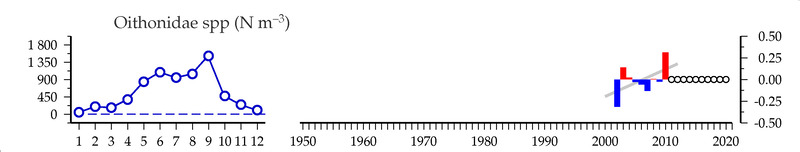
Oithonidae spp (#/m3)
Cirripedia larvae (#/m3)
Larvacea (#/m3)
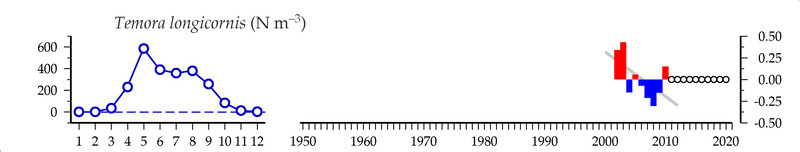
Temora longicornis (#/m3)
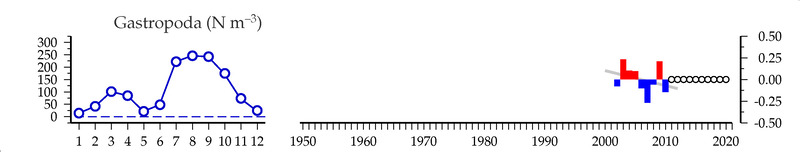
Gastropoda (#/m3)
Calanus spp. C1-4 (#/m3)
Paracalanus parvus (#/m3)
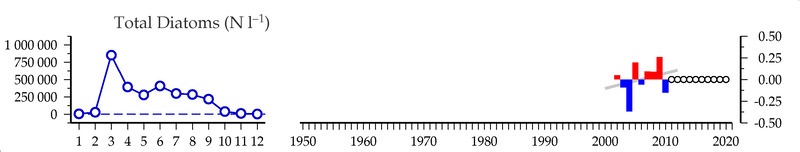
Total diatoms (cells/L)
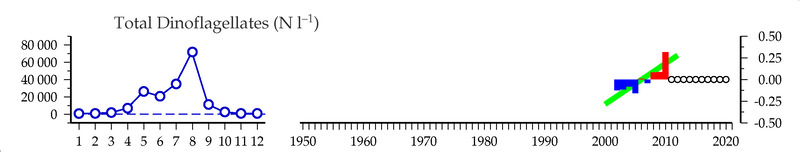
Total dinoflagellates (cells/L)
Chlorophyll (ug/l) averaged from 0-10 m
Temperature (C) at 1 m
Temperature (C) at 45 m
Salinity () 1 m
Salinity () 45 m
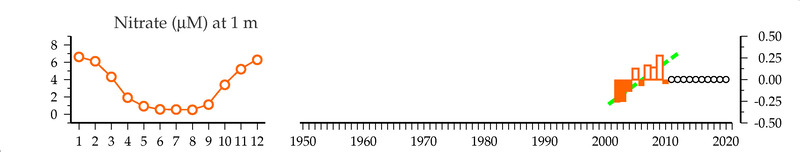
Nitrate (uM) at 1 m
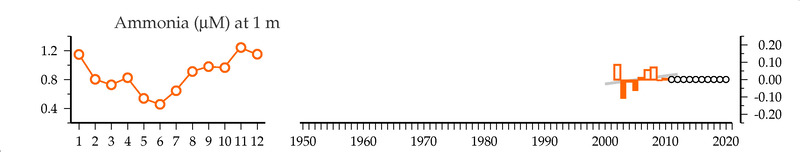
Ammonia (uM) at 1 m
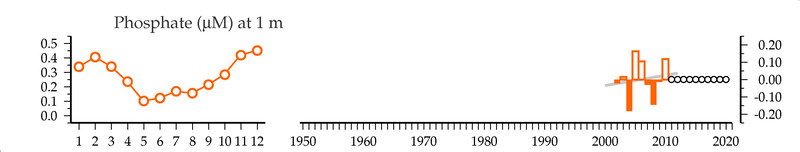
Phosphate (uM) at 1 m
Silicate (uM) at 1 m
Nitrate (uM) at 45 m
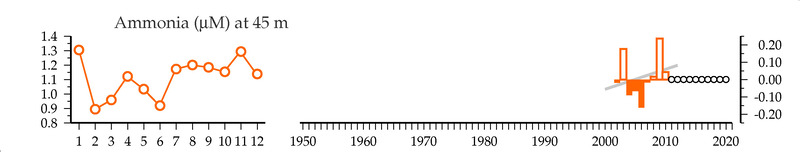
Ammonia (uM) at 45 m
Phosphate (uM) at 45 m
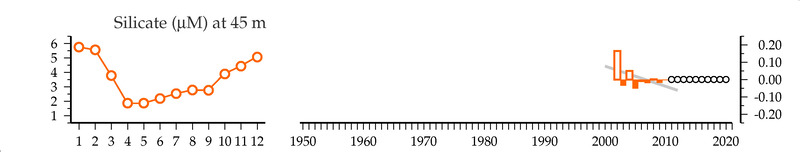
Silicate (uM) at 45 m
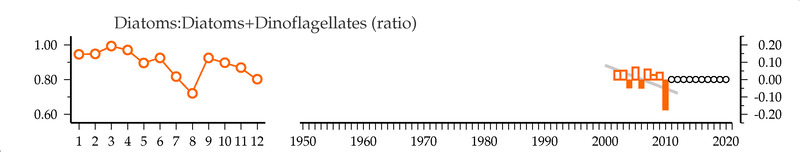
Diatoms:Diatoms+Dinoflagellates (ratio)
Reynolds OI-SST-v2 Temperature (C)
NASA-combo satellite Chlorophyll (mg/m3)
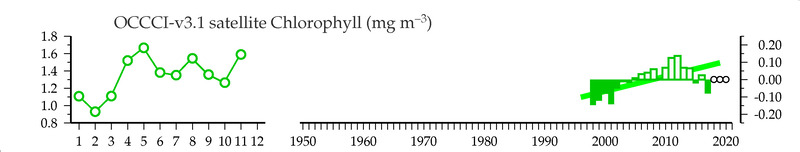
OCCCI-v3.1 satellite Chlorophyll (mg/m3)
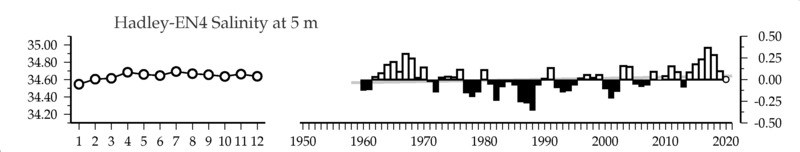
Hadley-EN4 Salinity () at 5 m
CMEMS Mixed Layer Depth (m)
CbPM2 NPP (mg-C/m2/day)
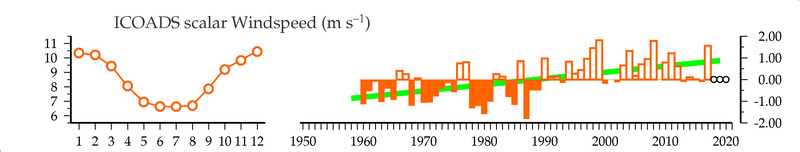
ICOADS scalar Windspeed (m/s)
ESRL Monthly Total Precipitation (mm/month) of nearest land
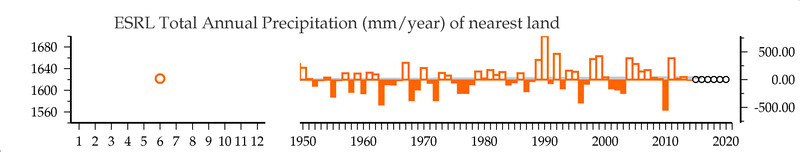
ESRL Total Annual Precipitation (mm/year) of nearest land
HadISST Sea Surface Temperature (C) from matching years
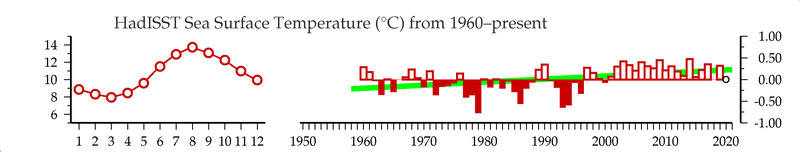
HadISST Sea Surface Temperature (C) from 1960-present
HadISST Sea Surface Temperature (C)
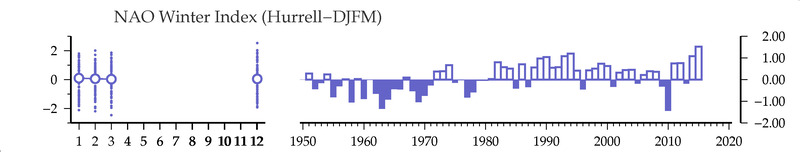
NAO Winter Index
Atlantic Multidecadal Oscillation Index
Arctic Oscillation Index (winter months)
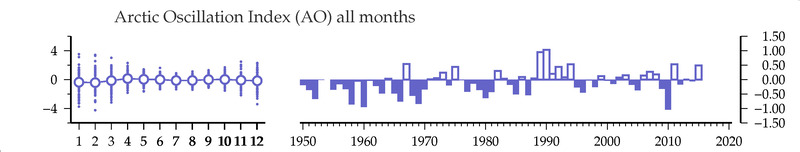
Arctic Oscillation Index
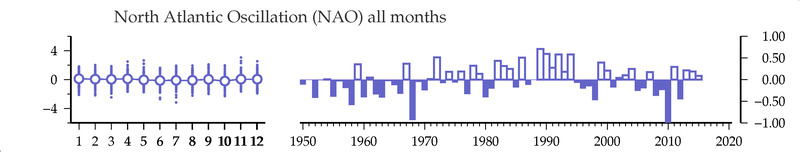
North Atlantic Oscillation