Multi-Variable Comparison & Correlation Plot (MVCCP)
Checked variables will have their figure shown below. Uncheck any variable to remove its plot from below.
Total Copepods (#/m3)
Total Zooplankton (#/m3)
Hydromedusae (#/m3)
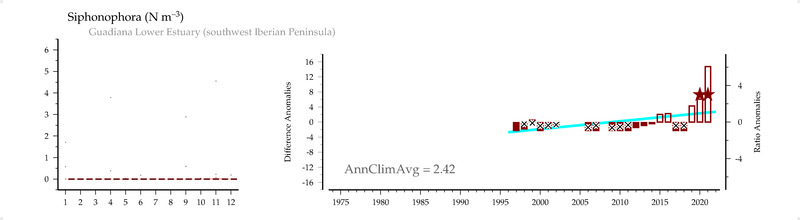
Siphonophora (#/m3)
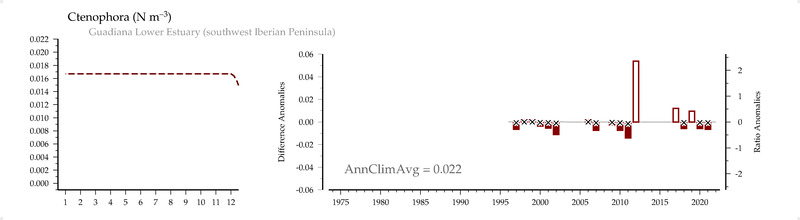
Ctenophora (#/m3)
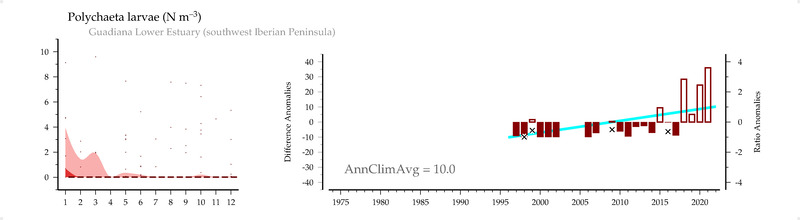
Polychaeta larvae (#/m3)
Cirripedia larvae (#/m3)
Cladocera (#/m3)
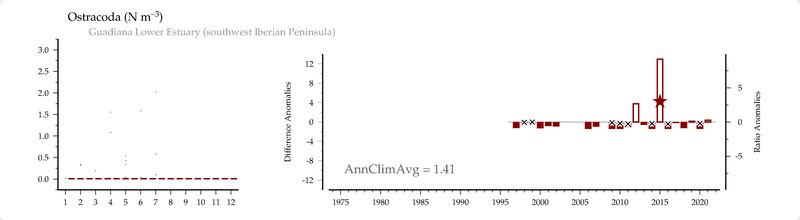
Ostracoda (#/m3)
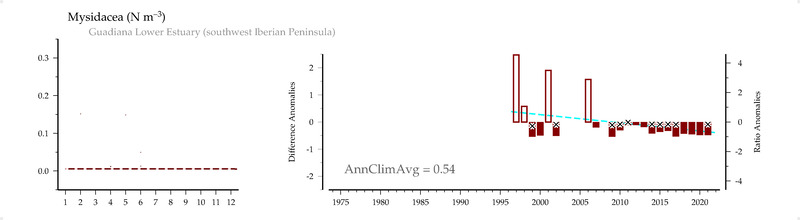
Mysidacea (#/m3)
Euphausiacea (#/m3)
Amphipoda (#/m3)
Insecta larvae (#/m3)
Isopoda (#/m3)
Decapoda larvae (#/m3)
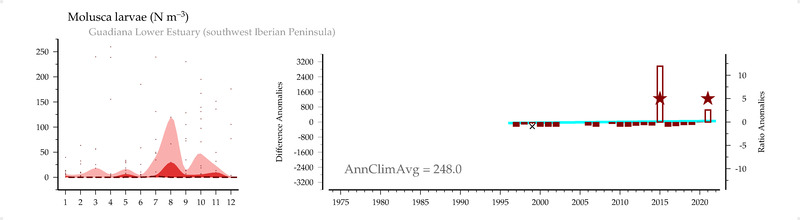
Molusca larvae (#/m3)
Chaetognatha (#/m3)
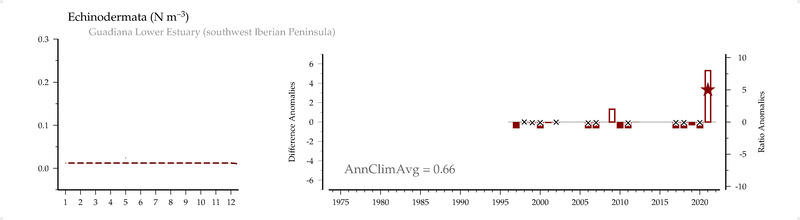
Echinodermata (#/m3)
Apendicularia (#/m3)
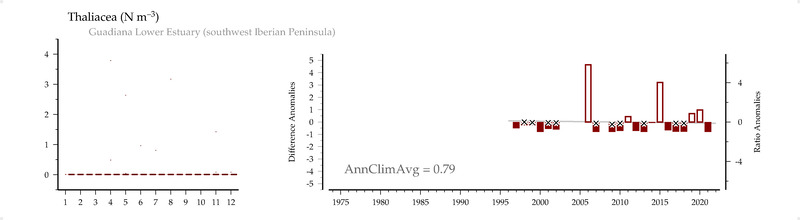
Thaliacea (#/m3)
Ascidiacea larvae (#/m3)
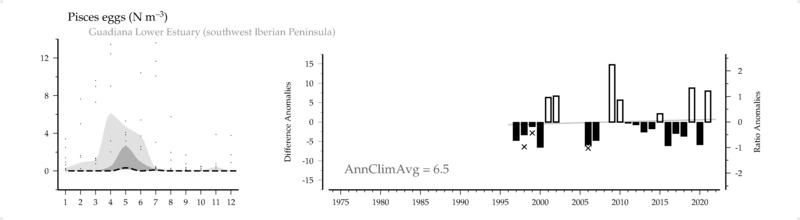
Pisces eggs (#/m3)
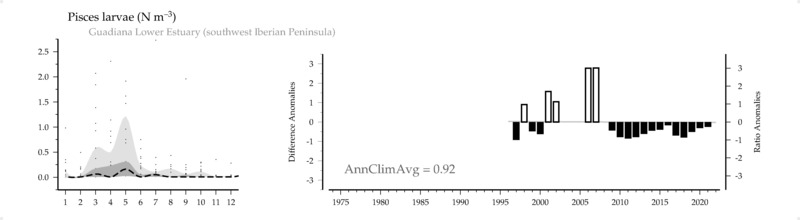
Pisces larvae (#/m3)
Temperature ( C ) at the surface
Salinity () at the surface
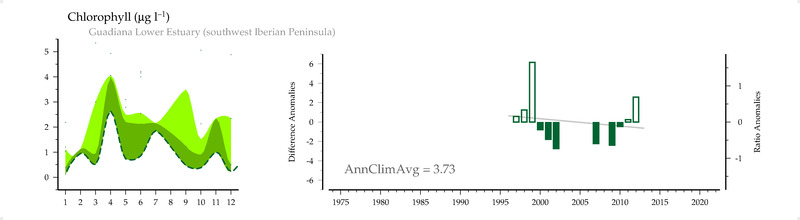
Chlorophyll (ug/l)
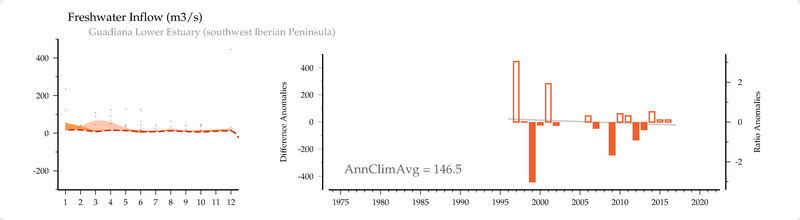
Freshwater Inflow (m3/s)
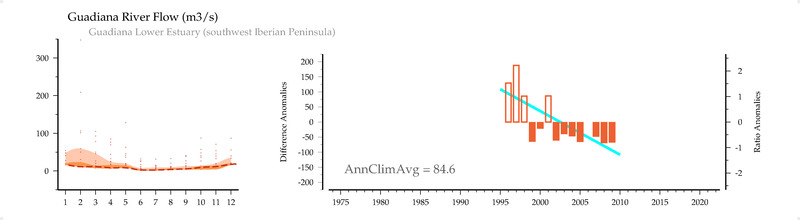
Guadiana River Flow (m3/s)
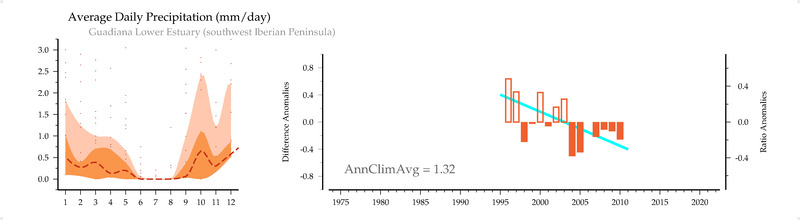
Average Daily Precipitation (mm/day)
Reynolds OI-SST-v2 Temperature (C)
NASA-combo satellite Chlorophyll (mg/m3)
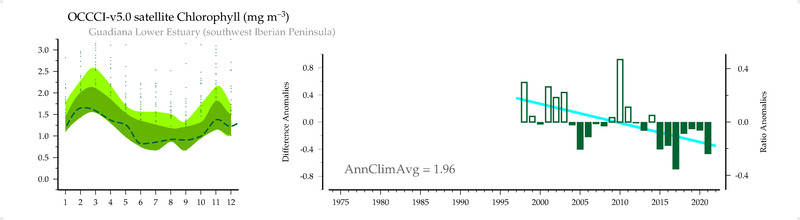
OCCCI-v5.0 satellite Chlorophyll (mg/m3)
Hadley-EN4 Salinity () at 5 m
CMEMS Mixed Layer Depth (m)
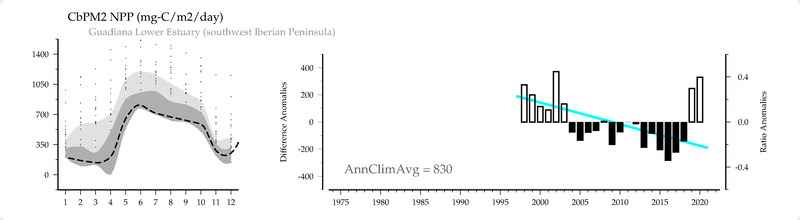
CbPM2 NPP (mg-C/m2/day)
ICOADS scalar Windspeed (m/s)
ESRL Monthly Total Precipitation (mm/month) of nearest land
ESRL Total Annual Precipitation (mm/year) of nearest land
HadISST Sea Surface Temperature (C) from matching years
HadISST Sea Surface Temperature (C) from 1960-present
HadISST Sea Surface Temperature (C)