|
Figure 1
:
The long-term climate-ecosystem change study, the Odate Project started in 2003 (project leader: Dr. Hiroya Sugisaki, TNFRI).
|

|
|
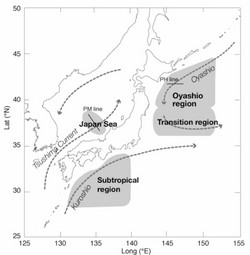
Figure 2
:
Map illustrating of the division of time series by region and current system.
|
|
|
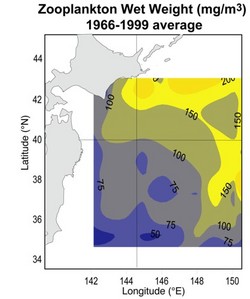
Figure 3
:
Distribution of zooplankton wet weight (mg m-3) in the Oyashio and the Transition zone based on the Odate Collection data set (average of May-Sep abundance for 1960-1999). Zooplankton was collected by vertical haul (0-150 m) of small ring net (diameter 45cm) with 0.33mm mesh.
|
|
|
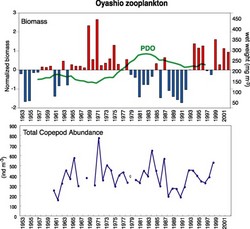
Figure 4
:
Time-series of summertime zooplankton wet weight (mg m-3) in the Oyashio (upper) and total zooplankton abundance (lower) (inds m-3). 10-year smoothed Pacific Decadal Oscillation index (PDO, https://tao.atmos.washington.edu/pdo/) are shown in a green line.
|
|
|
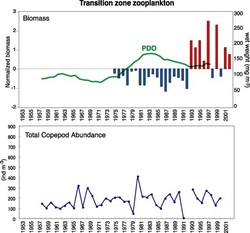
Figure 5
:
Time-series of summertime zooplankton wet weight (mg m-3) in the Transition zone (upper) and total zooplankton abundance (lower) (inds m-3). 10-year smoothed Pacific Decadal Oscillation index (PDO, https://tao.atmos.washington.edu/pdo/) are shown in a green line.
|
|