Multi-Variable Comparison & Correlation Plot (MVCCP)
Checked variables will have their figure shown below. Uncheck any variable to remove its plot from below.
Total Zooplankton (#/m3)
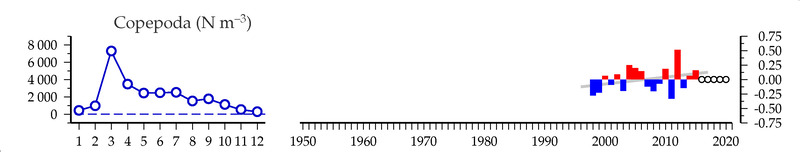
Copepoda (#/m3)
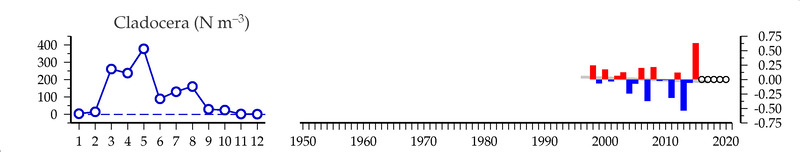
Cladocera (#/m3)
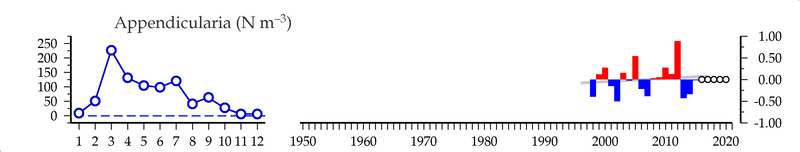
Appendicularia (#/m3)
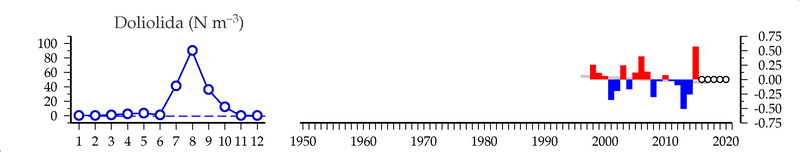
Doliolida (#/m3)
Noctiluca scintillans (#/m3)
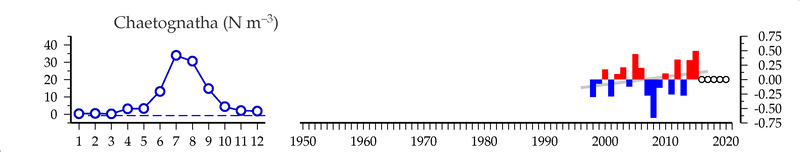
Chaetognatha (#/m3)
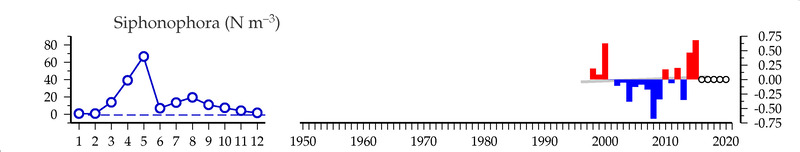
Siphonophora (#/m3)
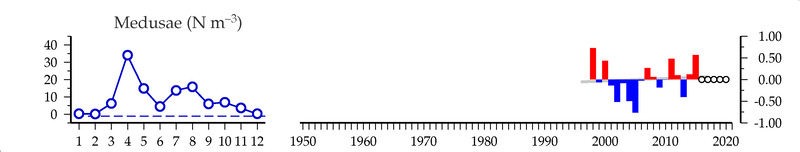
Medusae (#/m3)
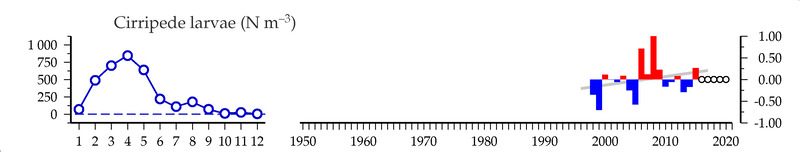
Cirripede larvae (#/m3)
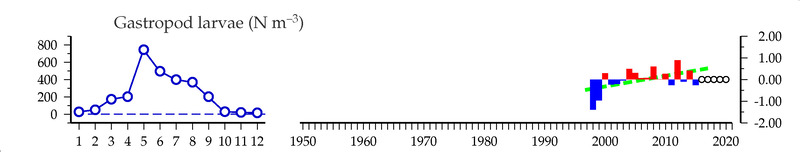
Gastropod larvae (#/m3)
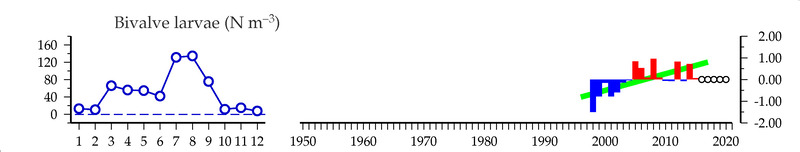
Bivalve larvae (#/m3)
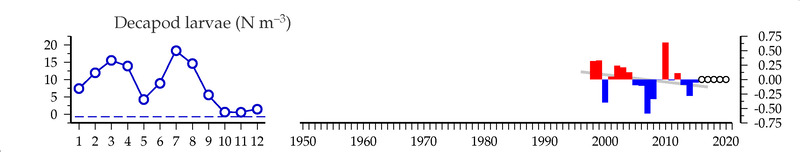
Decapod larvae (#/m3)
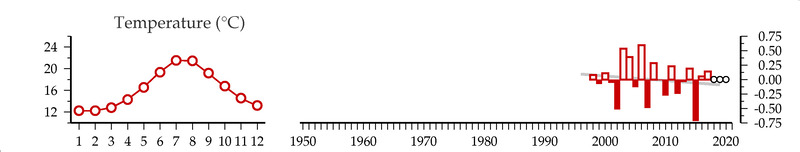
Temperature (C)
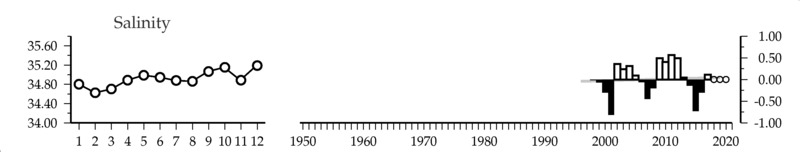
Salinity ()
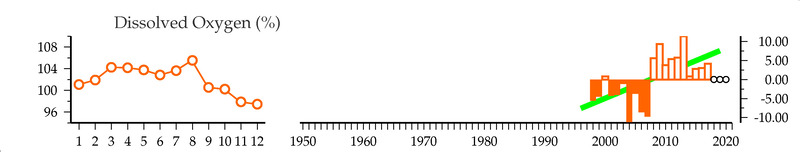
Dissolved Oxygen (%)
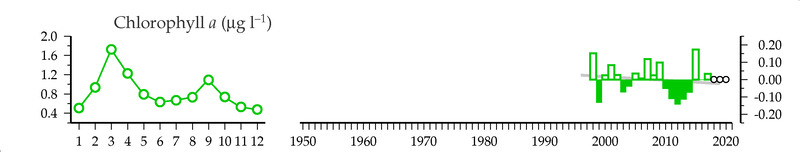
Chlorophyll-a (ug/l)
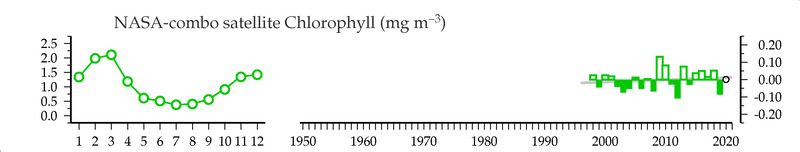
NASA-combo satellite Chlorophyll (mg/m3)
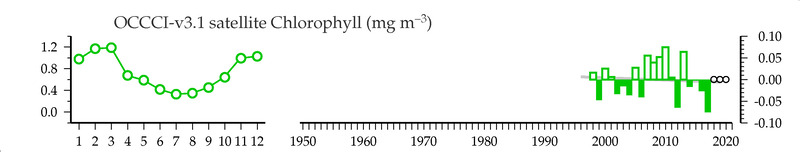
OCCCI-v3.1 satellite Chlorophyll (mg/m3)
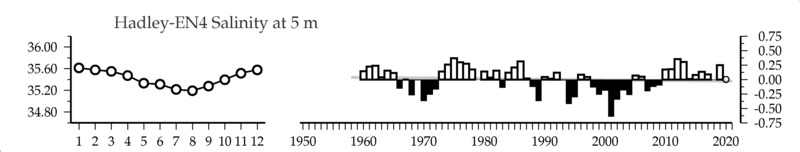
Hadley-EN4 Salinity () at 5 m
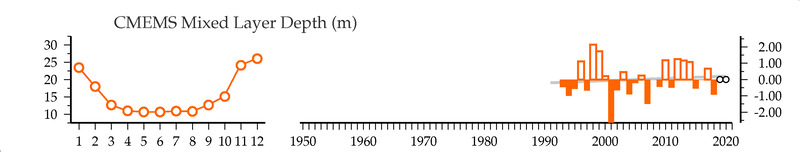
CMEMS Mixed Layer Depth (m)
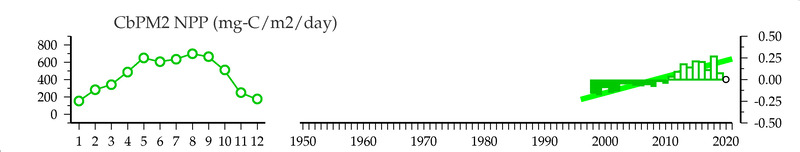
CbPM2 NPP (mg-C/m2/day)
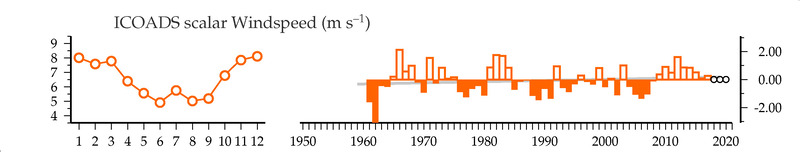
ICOADS scalar Windspeed (m/s)
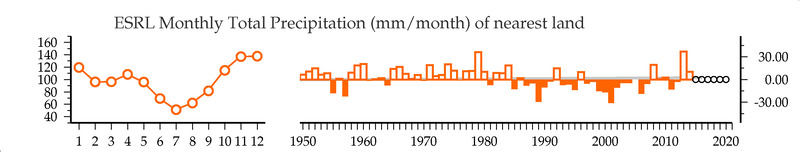
ESRL Monthly Total Precipitation (mm/month) of nearest land
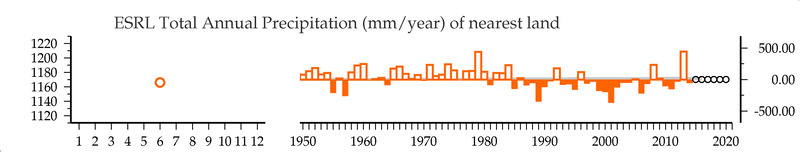
ESRL Total Annual Precipitation (mm/year) of nearest land
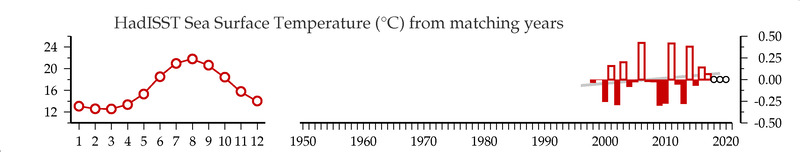
HadISST Sea Surface Temperature (C) from matching years
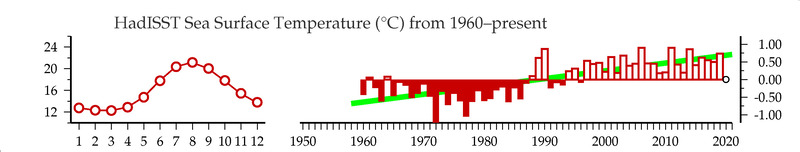
HadISST Sea Surface Temperature (C) from 1960-present
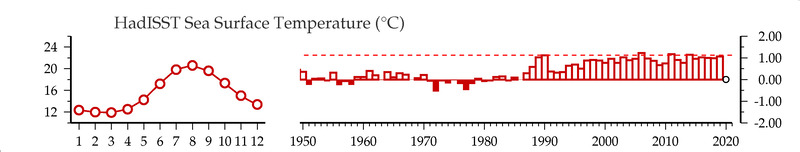
HadISST Sea Surface Temperature (C)
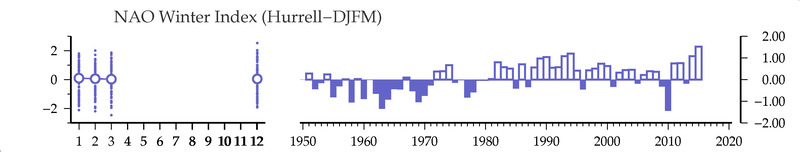
NAO Winter Index
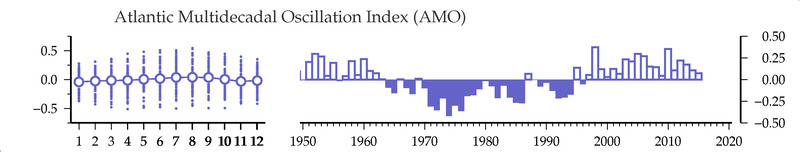
Atlantic Multidecadal Oscillation Index
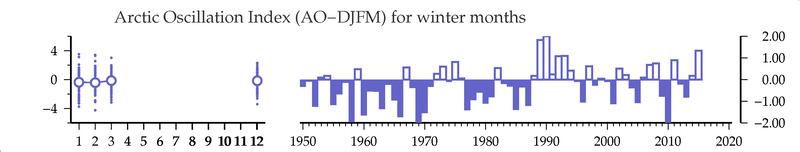
Arctic Oscillation Index (winter months)
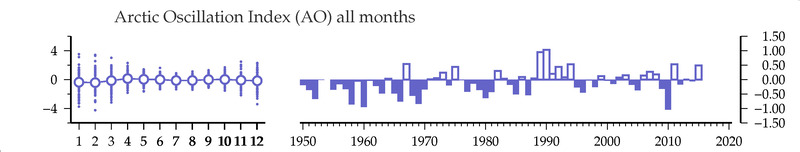
Arctic Oscillation Index
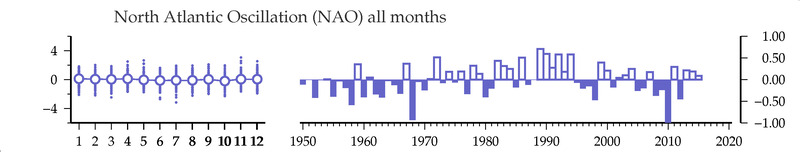
North Atlantic Oscillation