Multi-Variable Comparison & Correlation Plot (MVCCP)
Checked variables will have their figure shown below. Uncheck any variable to remove its plot from below.
Temperature ( C ) from 0-28 m
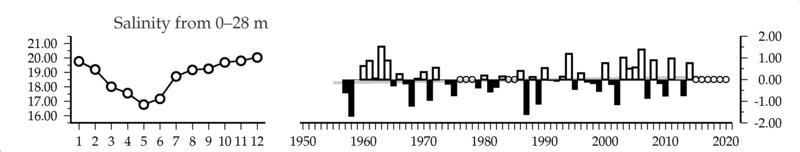
Salinity () from 0-28 m
Oxygen (uM) from 0-28 m
pH () from 0-28 m
NO2 (uM) from 0-28 m
SiO4 (uM) from 0-28 m
NH4 (uM) from 0-28 m
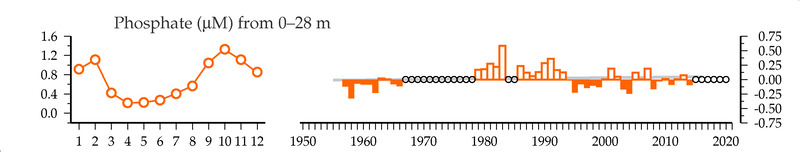
PO4 (uM) from 0-28 m
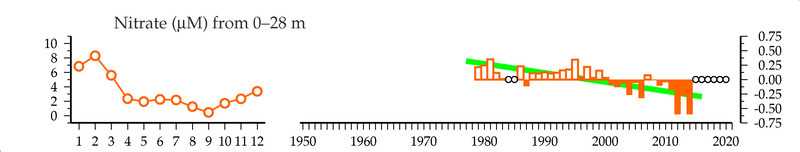
NO3 (uM) from 0-28 m
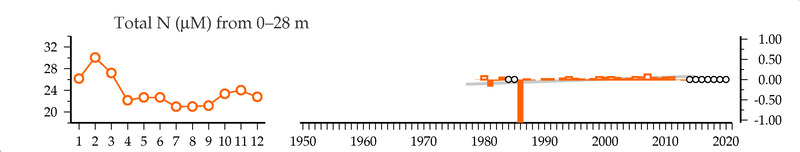
Total N (uM) from 0-28 m
Total P (uM) from 0-28 m
Secchi Depth (m) from 0-28 m
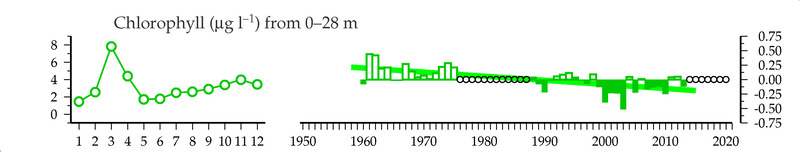
Chlorophyll (ug/l) from 0-28 m
Seston dry weight (mg/L) from 0-28 m
Primary Production (mgC/m3/h) from 0-28 m
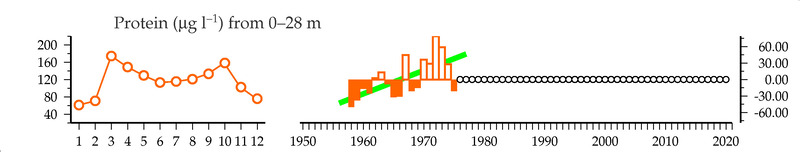
Protein (ug/L) from 0-28 m
Total Bacteria (#/ml) from 0-28 m
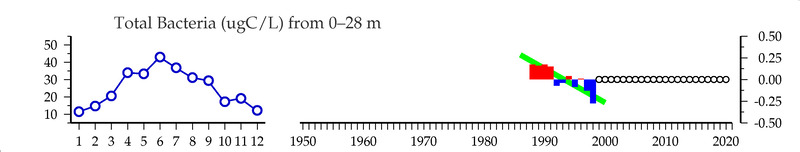
Total Bacteria (ugC/L) from 0-28 m
Total Alkalinity (umol/kg) from 0-28 m
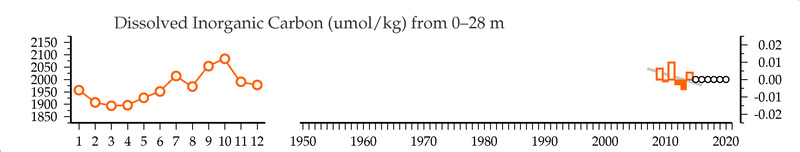
Dissolved Inorganic Carbon (umol/kg) from 0-28 m
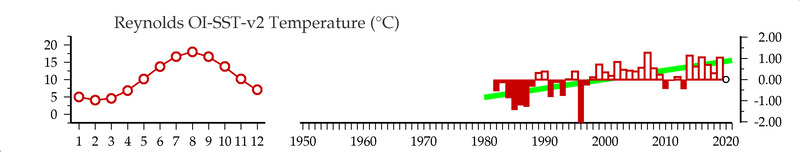
Reynolds OI-SST-v2 Temperature (C)
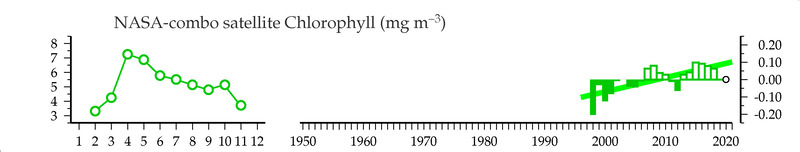
NASA-combo satellite Chlorophyll (mg/m3)
OCCCI-v3.1 satellite Chlorophyll (mg/m3)
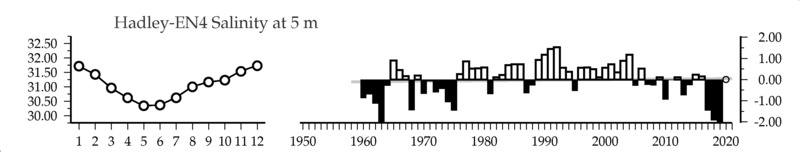
Hadley-EN4 Salinity () at 5 m
CMEMS Mixed Layer Depth (m)
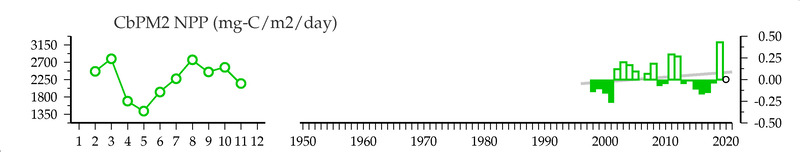
CbPM2 NPP (mg-C/m2/day)
ICOADS scalar Windspeed (m/s)
ESRL Monthly Total Precipitation (mm/month) of nearest land
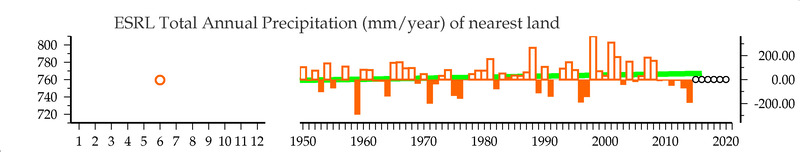
ESRL Total Annual Precipitation (mm/year) of nearest land
HadISST Sea Surface Temperature (C) from matching years
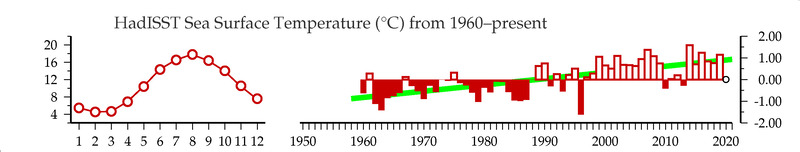
HadISST Sea Surface Temperature (C) from 1960-present
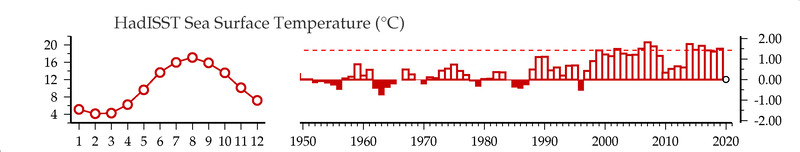
HadISST Sea Surface Temperature (C)
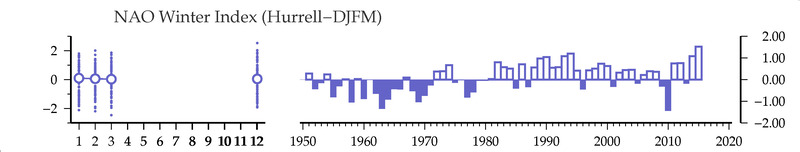
NAO Winter Index
Atlantic Multidecadal Oscillation Index
Arctic Oscillation Index (winter months)
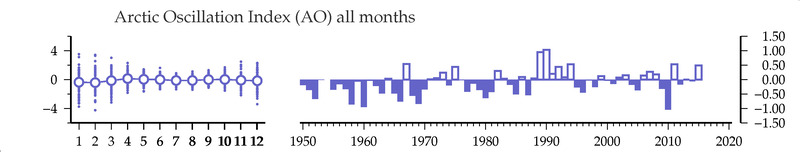
Arctic Oscillation Index
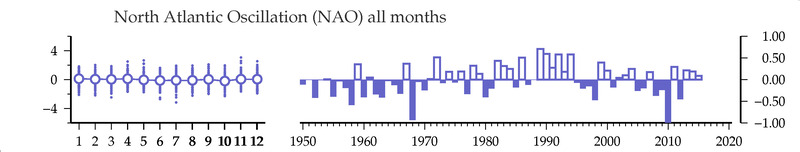
North Atlantic Oscillation