Multi-Variable Comparison & Correlation Plot (MVCCP)
Checked variables will have their figure shown below. Uncheck any variable to remove its plot from below.
Total Diatoms (#/L)
Total Dinoflagellates (#/L)
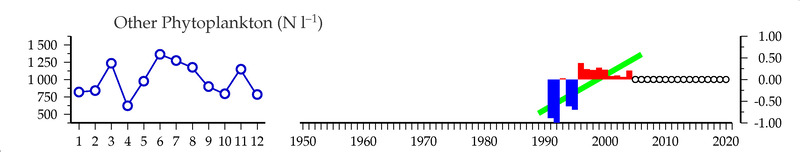
Other Phytoplankton (#/L)
Total Phytoplankton (#/L)
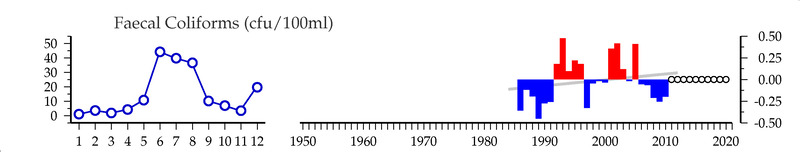
Faecal Coliforms (cfu/100ml)
Escherichia coli (cfu/100ml)
Temperature (C) at the surface
Salinity () at the surface
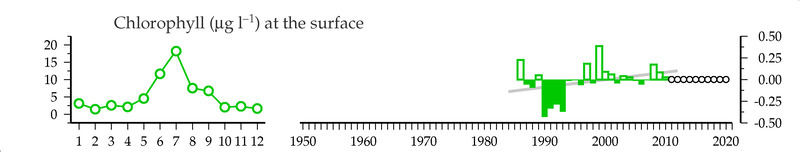
Chlorophyll (ug/l) at the surface
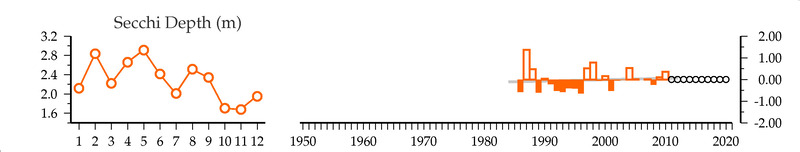
Secchi Depth (m)
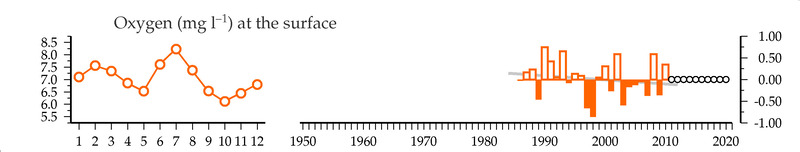
Oxygen (mg/l) at the surface
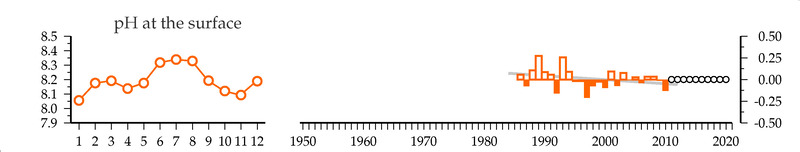
pH () at the surface
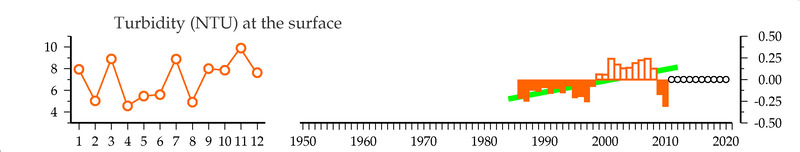
Turbidity (NTU) at the surface
NO3-N (mg/l) at the surface
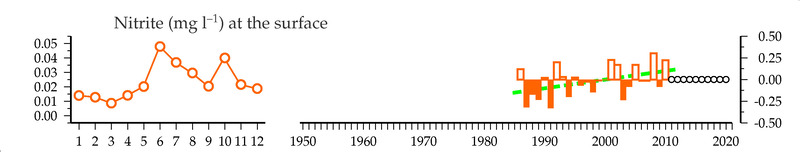
NO2-N (mg/l) at the surface
Ammonium-N (mg/l) at the surface
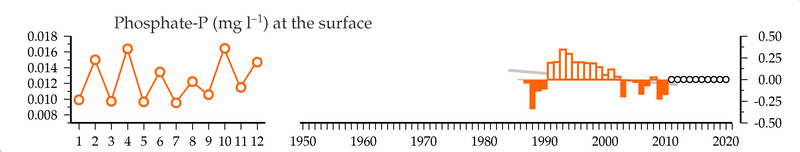
Phosphate-P (mg/l) at the surface
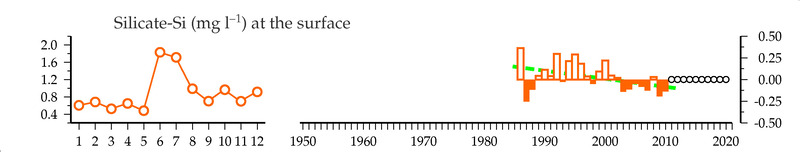
Silicate-Si (mg/l) at the surface
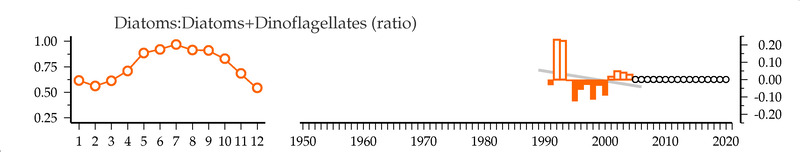
Diatoms:Diatoms+Dinoflagellates (ratio)
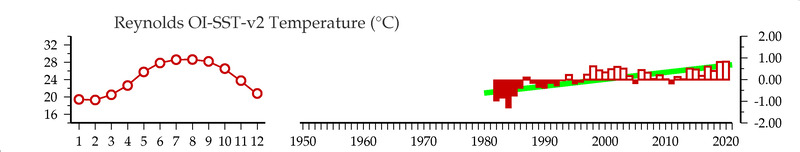
Reynolds OI-SST-v2 Temperature (C)
NASA-combo satellite Chlorophyll (mg/m3)
OCCCI-v3.1 satellite Chlorophyll (mg/m3)
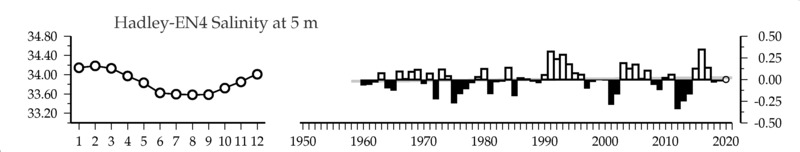
Hadley-EN4 Salinity () at 5 m
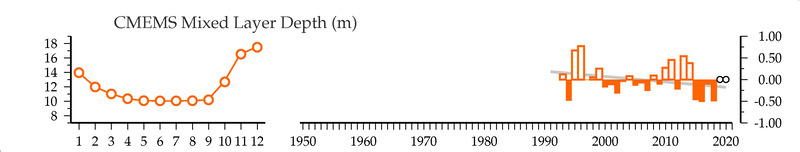
CMEMS Mixed Layer Depth (m)
CbPM2 NPP (mg-C/m2/day)
ICOADS scalar Windspeed (m/s)
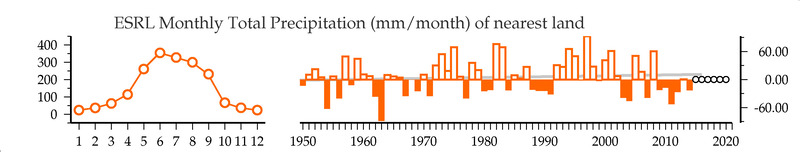
ESRL Monthly Total Precipitation (mm/month) of nearest land
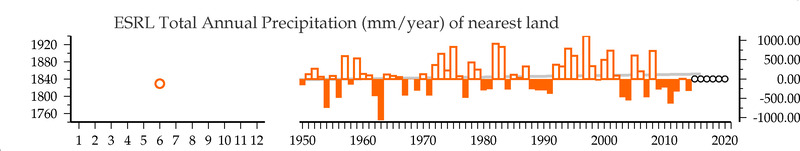
ESRL Total Annual Precipitation (mm/year) of nearest land
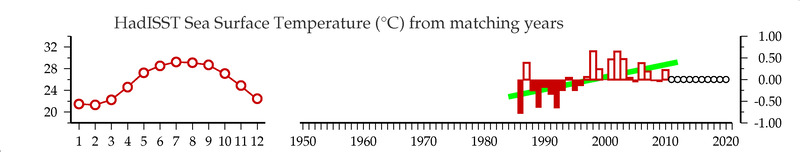
HadISST Sea Surface Temperature (C) from matching years
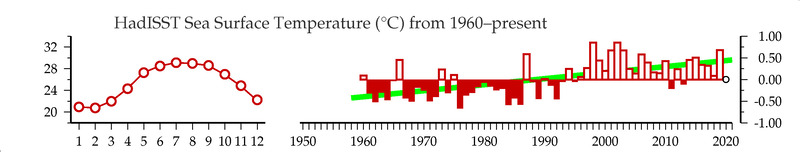
HadISST Sea Surface Temperature (C) from 1960-present
HadISST Sea Surface Temperature (C)
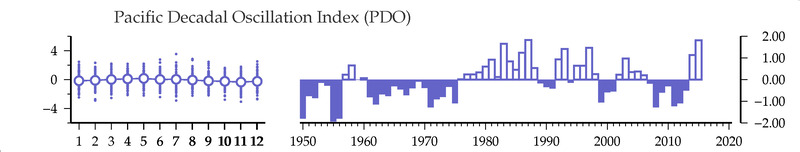
Pacific Decadal Oscillation
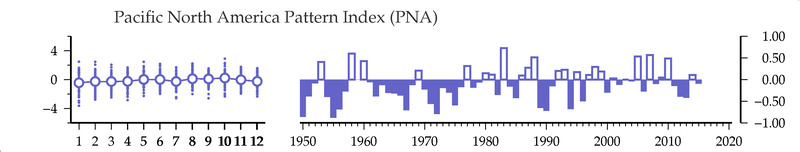
Pacific North America Patten
Nino 3.4
Trans-Nino Index
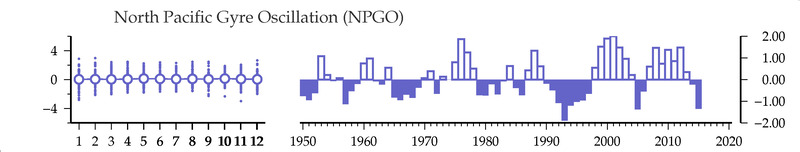
North Pacific Gyre Oscillation