Multi-Variable Comparison & Correlation Plot (MVCCP)
Checked variables will have their figure shown below. Uncheck any variable to remove its plot from below.
Total Phytoplankton (#/L)
Total Diatoms (#/L)
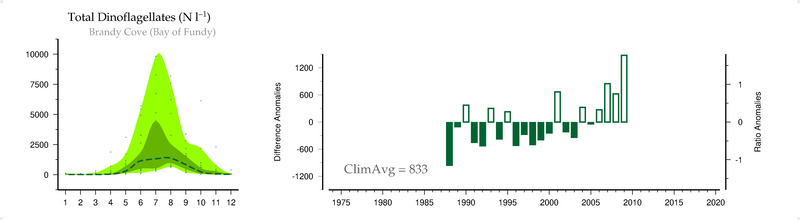
Total Dinoflagellates (#/L)
Other Phytoplankton (#/L)
Diatoms as % of Total Phytoplankton (ratio)
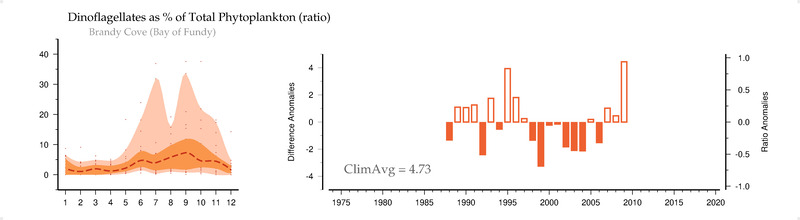
Dinoflagellates as % of Total Phytoplankton (ratio)
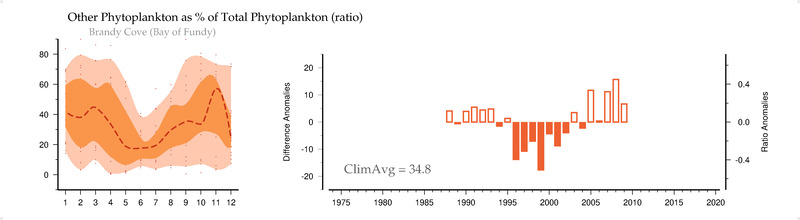
Other Phytoplankton as % of Total Phytoplankton (ratio)
Number of Phytoplankton Species
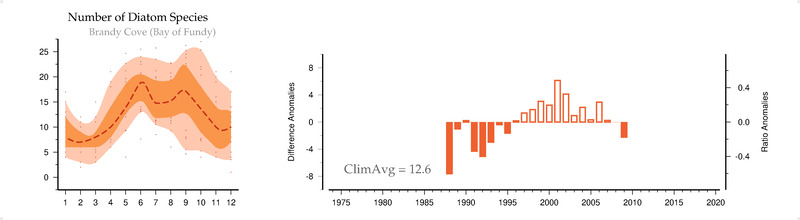
Number of Diatom Species
Number of Dinoflagellate Species
Number of Other Phytoplankton Species
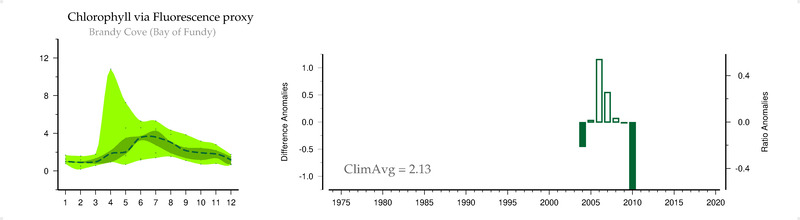
Chlorophyll via Fluorescence proxy ()
Temperature ( C ) at the surface
Salinity (pss) at the surface
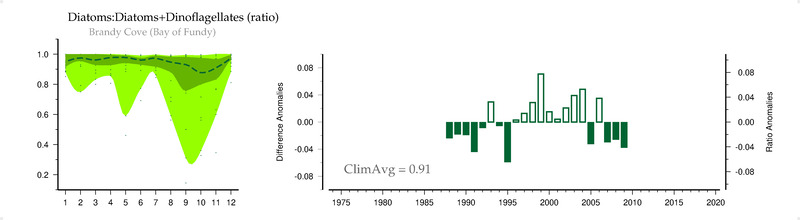
Diatoms:Diatoms+Dinoflagellates (ratio)
NASA-combo satellite Chlorophyll (mg/m3)
OCCCI-v3.1 satellite Chlorophyll (mg/m3)
Hadley-EN4 Salinity () at 5 m
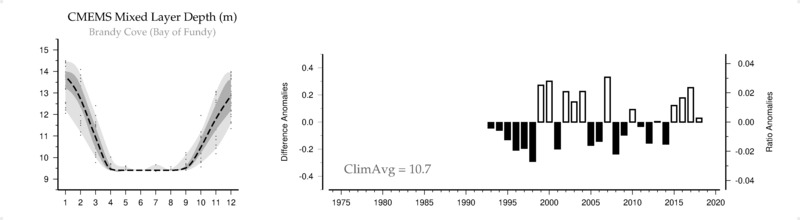
CMEMS Mixed Layer Depth (m)
ICOADS scalar Windspeed (m/s)
ESRL Monthly Total Precipitation (mm/month) of nearest land
ESRL Total Annual Precipitation (mm/year) of nearest land
HadISST Sea Surface Temperature (C) from matching years
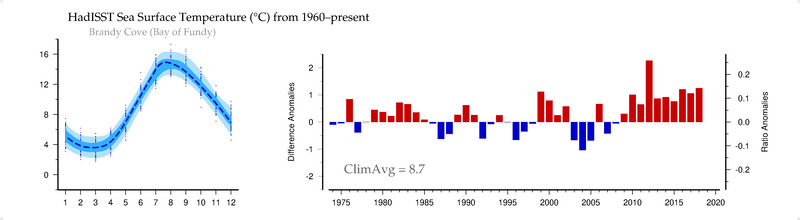
HadISST Sea Surface Temperature (C) from 1960-present
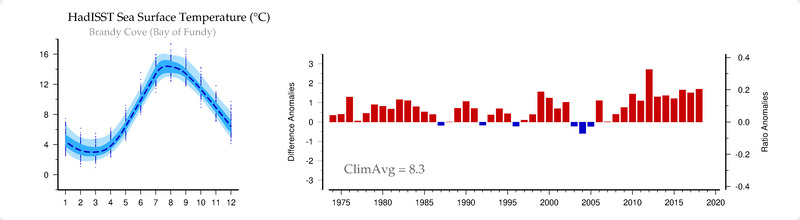
HadISST Sea Surface Temperature (C)